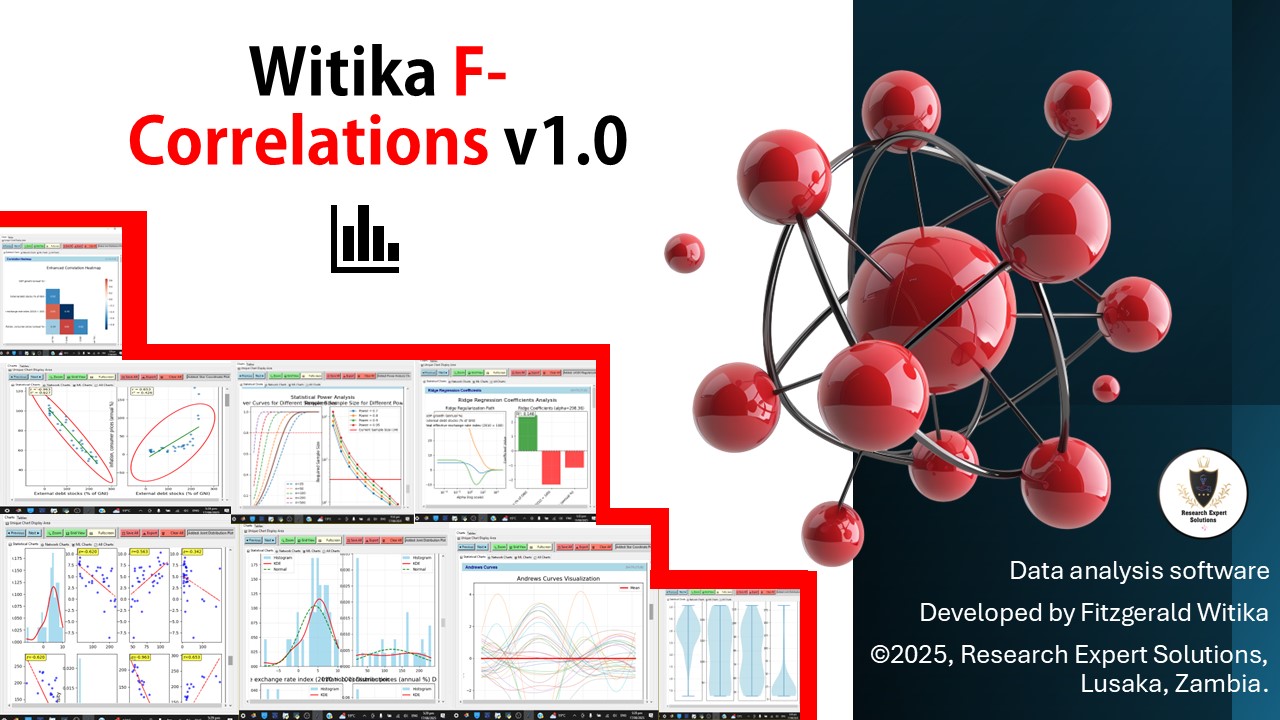
Witika F-Correlations v1.0 – Unlock the Hidden Power of Your Data
In today’s world, data is at the heart of innovation, decision-making, and problem-solving. From academic research and policy development to business strategy and corporate analysis, the ability to discover meaningful patterns within datasets is what separates average results from groundbreaking outcomes. Witika F-Correlations v1.0, developed by Fitzgerald Witika, CEO of Research Expert Solutions, is a state-of-the-art analytics suite designed to empower users to transform data into actionable insights. Built with precision, versatility, and user-friendliness in mind, this software is not just another statistics package—it is a revolutionary platform tailored to meet the needs of diverse users across academic, research, and corporate landscapes.
A New Era of Data Exploration
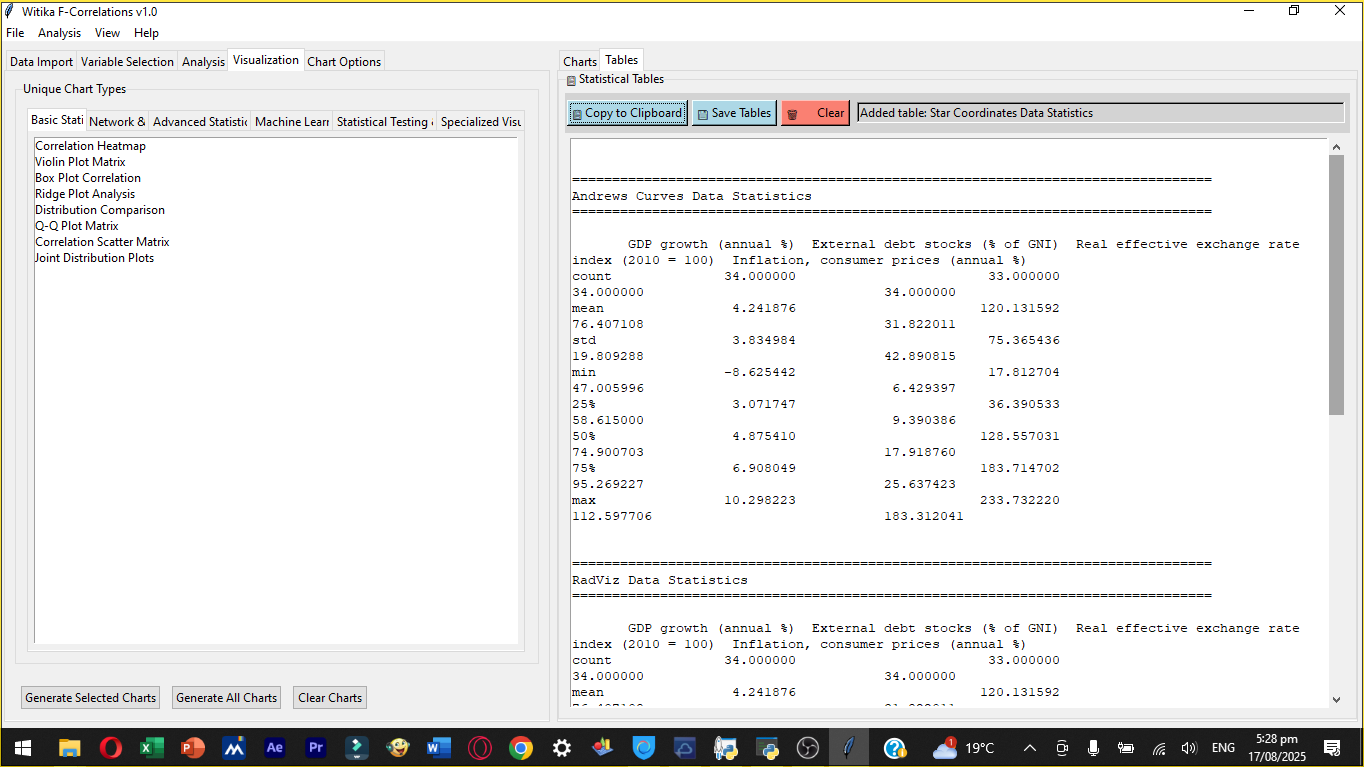
Unlike traditional statistical tools that limit users to a narrow range of analyses and generic visualizations, Witika F-Correlations v1.0 goes further by combining advanced correlation methods, unique charting options, machine learning techniques, and project management features into one unified environment.
The software offers a broad spectrum of correlation techniques—from classical approaches such as Pearson, Spearman, and Kendall to advanced options like partial correlations, semi-partial correlations, mutual information, and distance correlation. This flexibility ensures that whether you are handling small, controlled datasets or large, complex, and multi-variable data, the software adapts to your analytical needs.
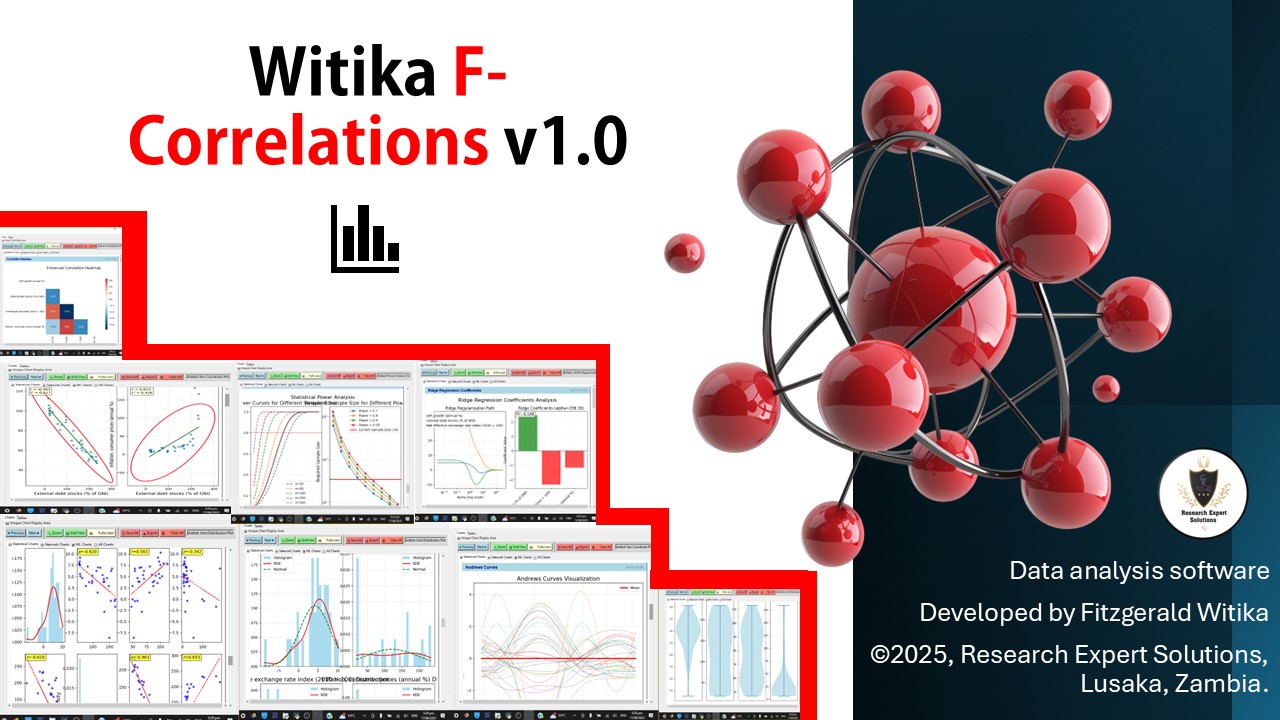
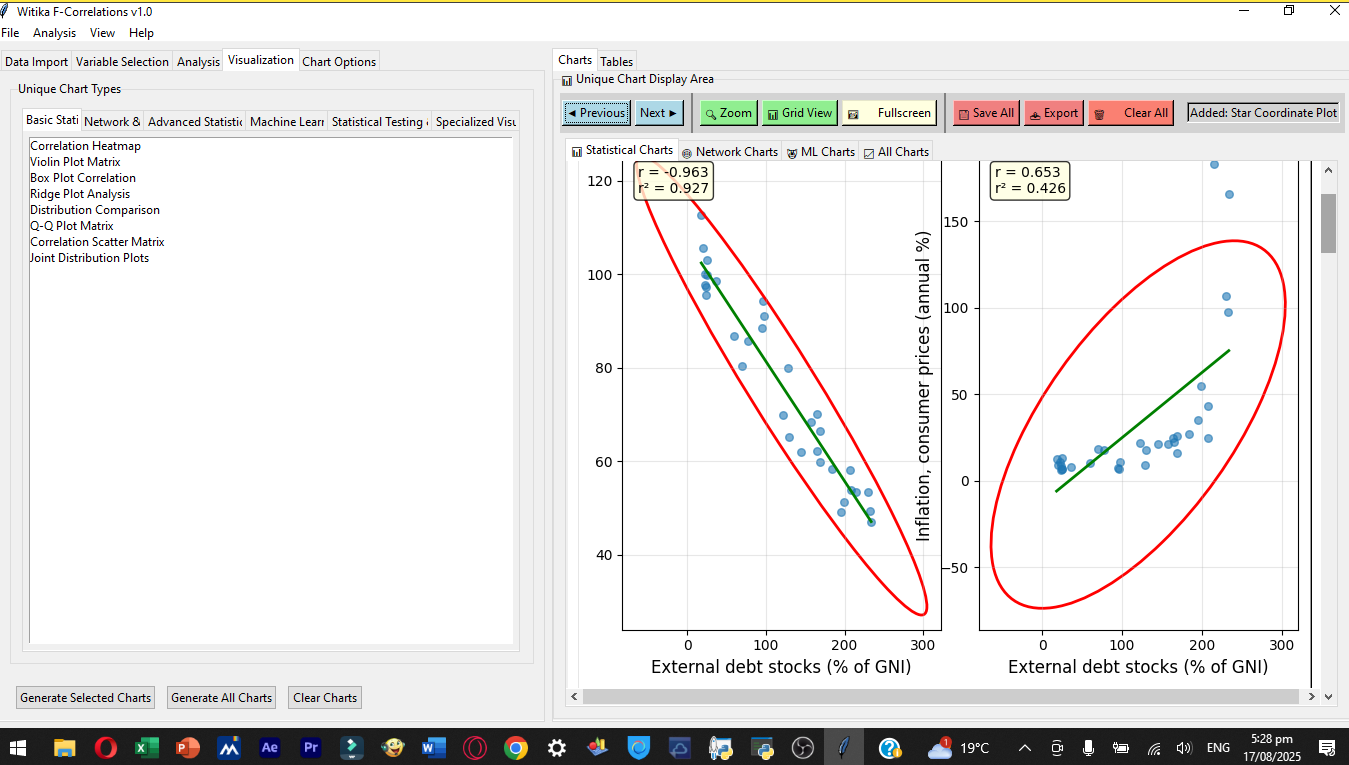
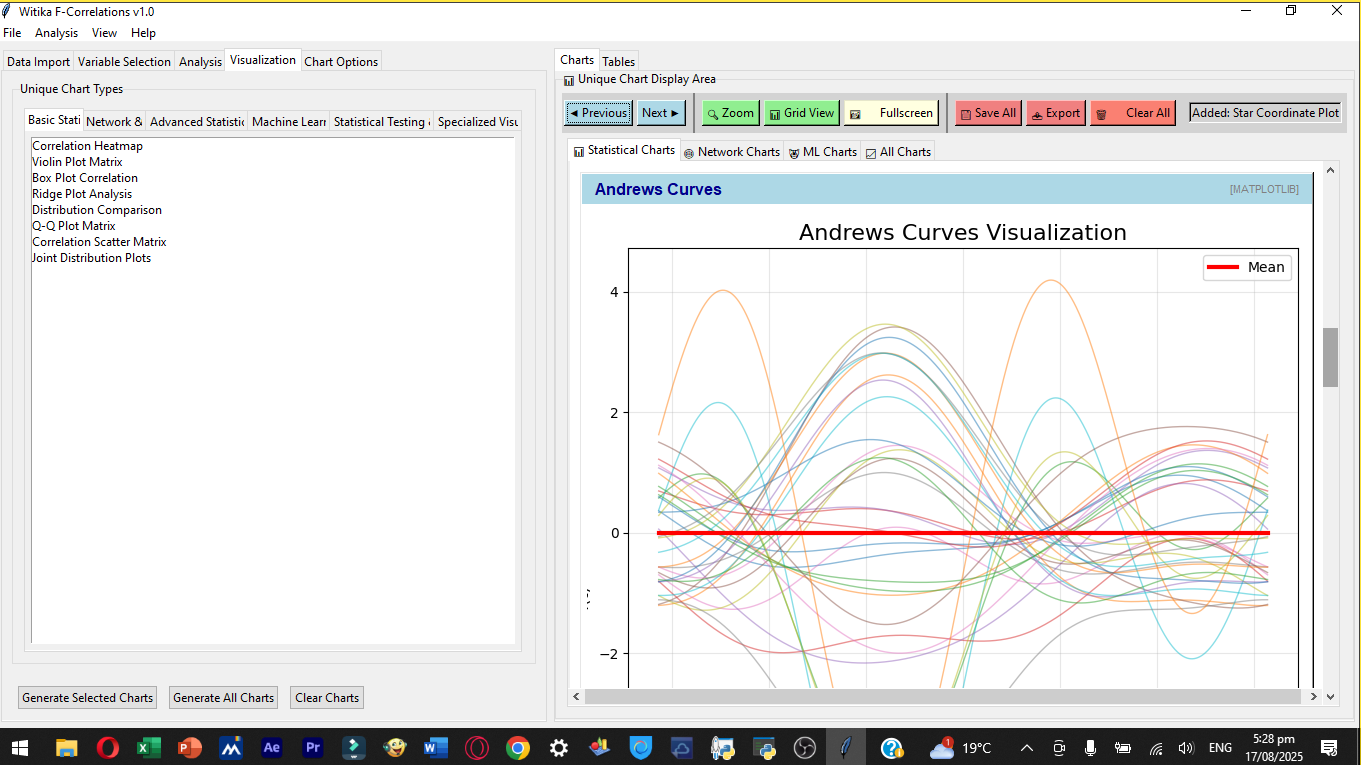
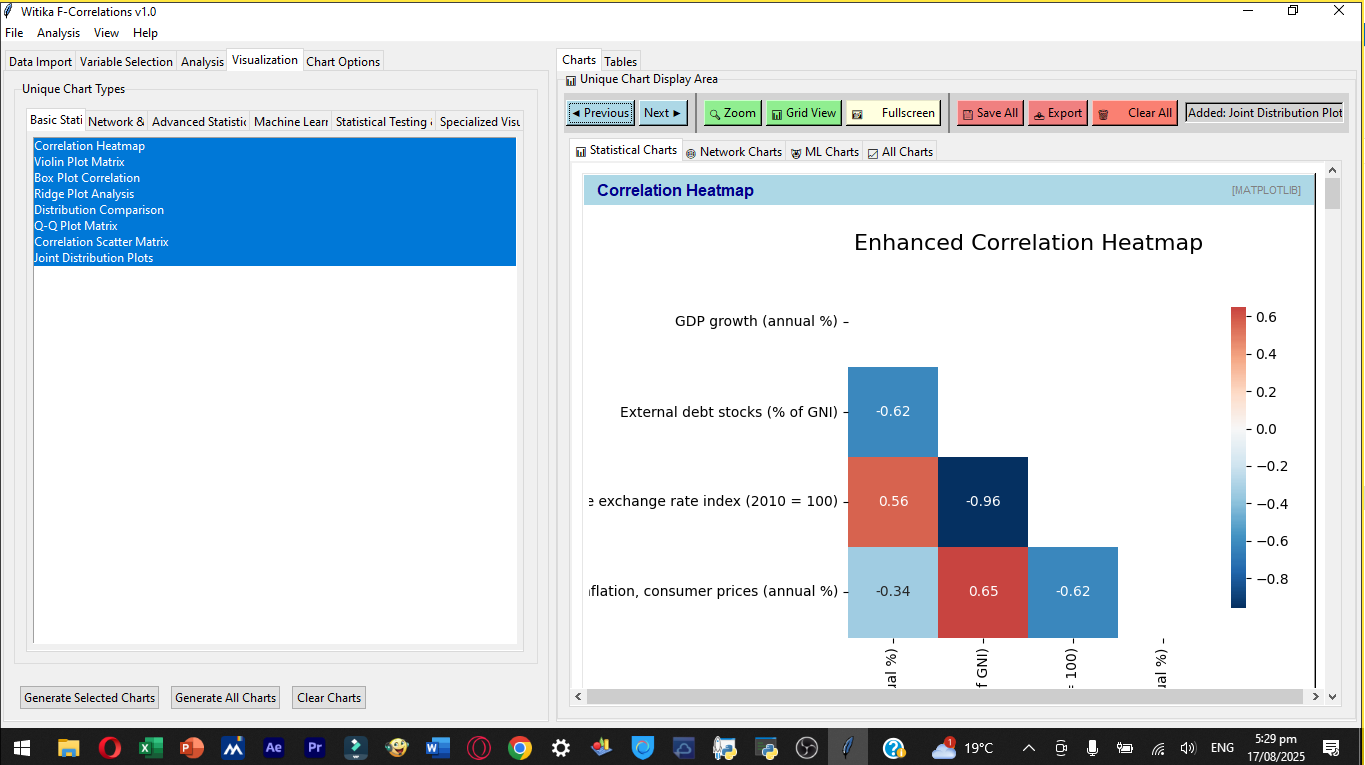
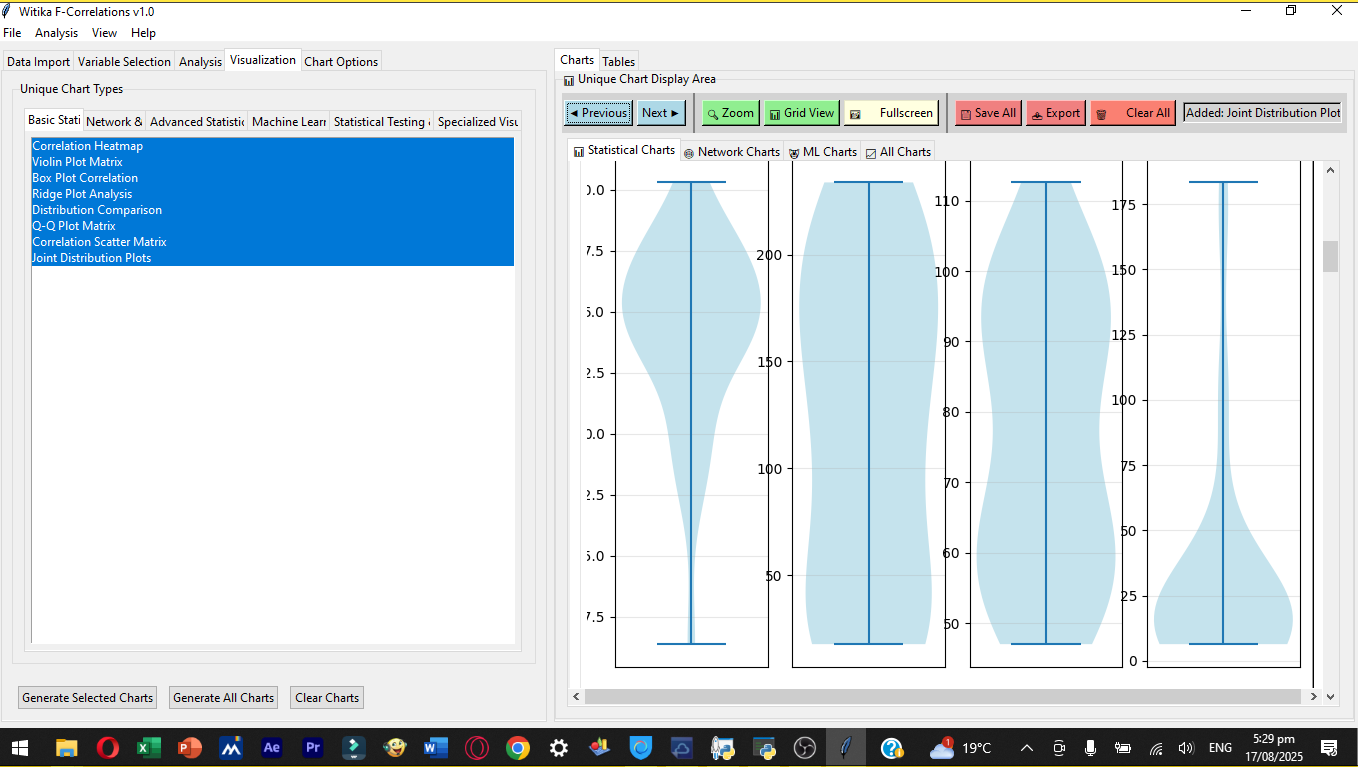
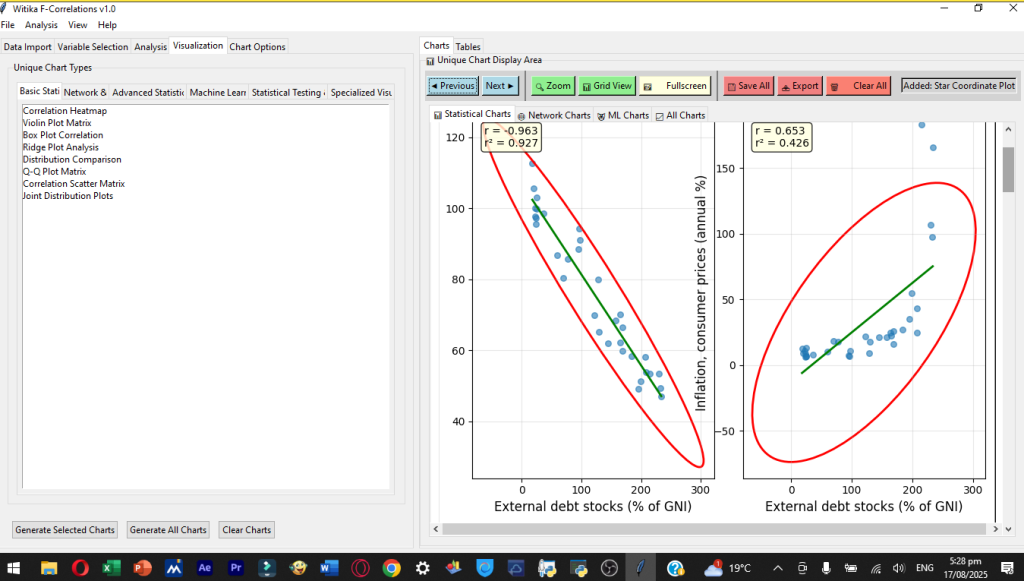
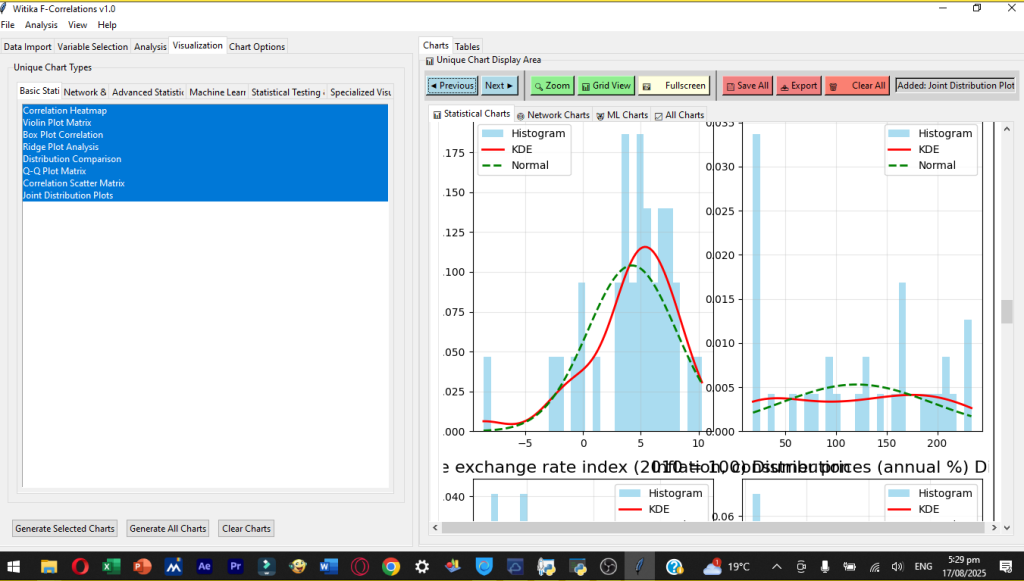
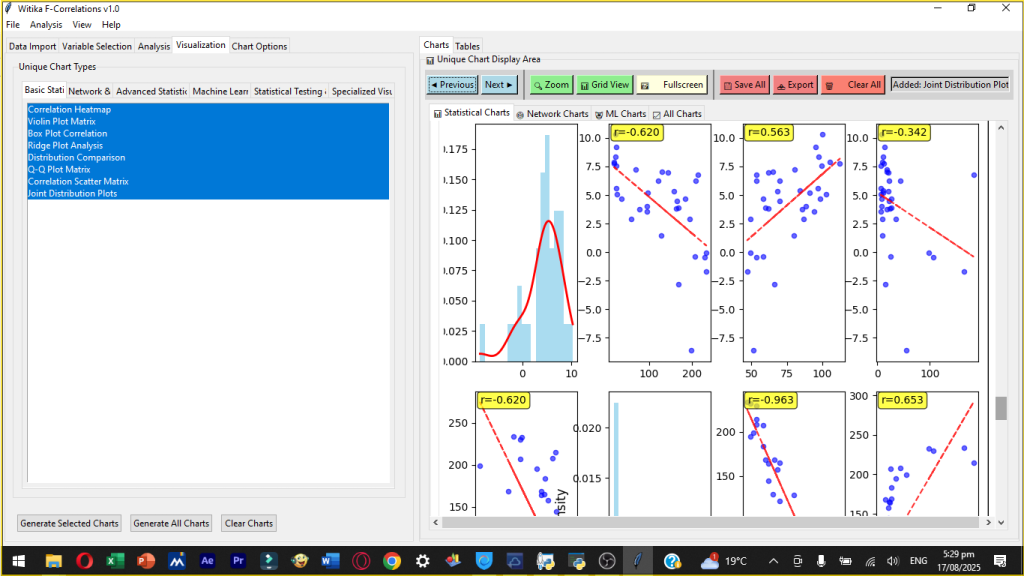
But correlation analysis is just the beginning. Witika F-Correlations v1.0 shines brightest in its visual storytelling capability. Users can generate unique, professional-grade visualizations that bring clarity to complex findings. From violin plot matrices, ridge plots, and joint distribution charts to network graphs, clustering diagrams, PCA visualizations, and machine learning feature importance plots, every chart is designed to reveal patterns that are often invisible in raw numbers.
For Researchers: Elevating Analytical Rigor
For researchers, data analysis is more than just crunching numbers—it is about producing results that can withstand the scrutiny of peer review and make real contributions to knowledge. Witika F-Correlations v1.0 was designed with this purpose at its core.
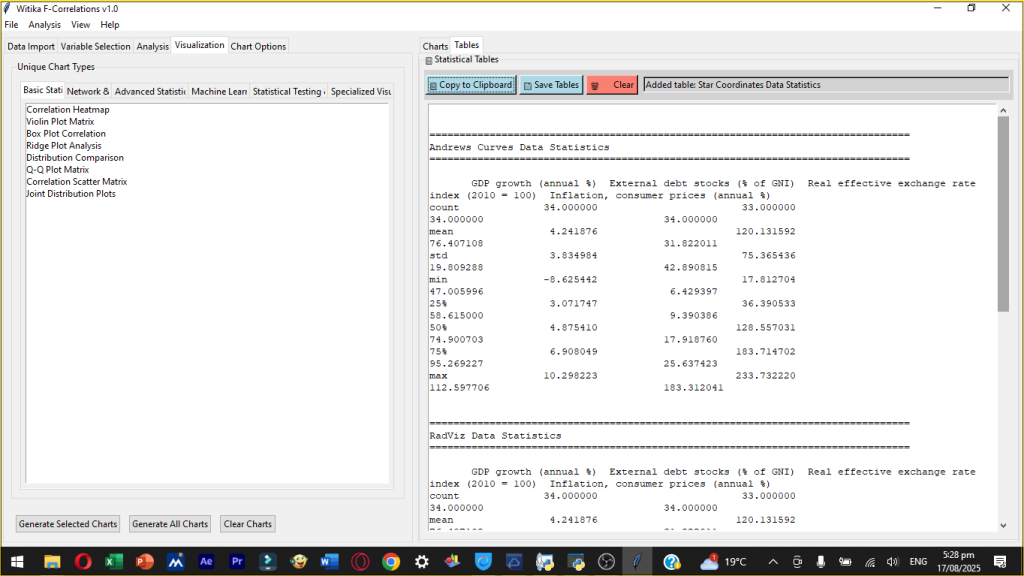
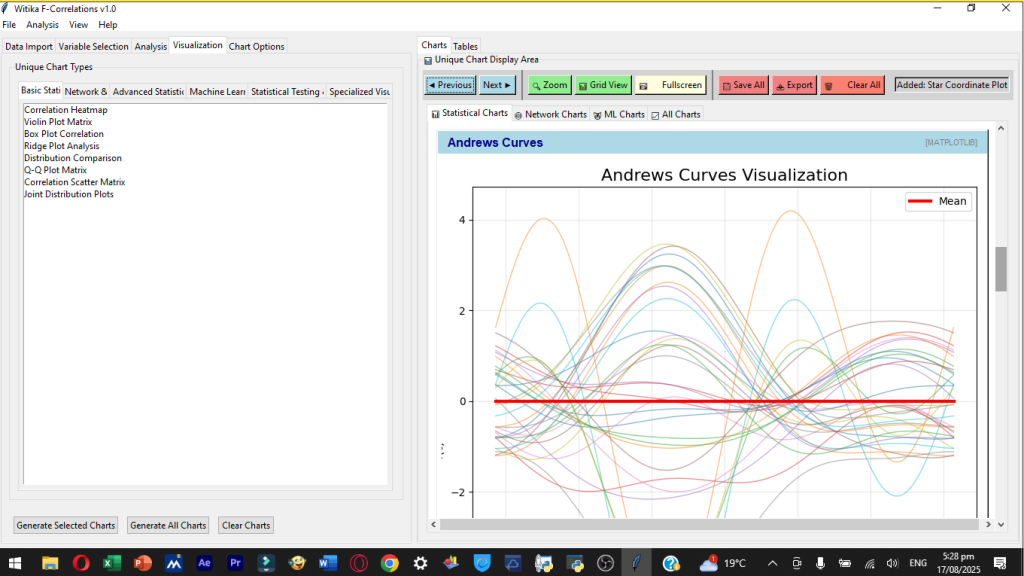
Researchers often struggle with the dual challenges of statistical accuracy and interpretability of results. This software addresses both. The advanced correlation methods ensure that relationships among variables are measured with precision, reducing the risk of misinterpretation. Meanwhile, the software’s interactive visualization suite transforms abstract numerical outputs into clear, compelling insights that can be easily integrated into research papers, presentations, and reports.
Whether working in social sciences, natural sciences, economics, health research, or engineering, researchers can use Witika F-Correlations v1.0 to:
Identify hidden relationships in their data.
Explore the strength, direction, and complexity of variable interactions.
Visualize results using publication-ready charts.
Manage projects effectively through built-in saving, exporting, and report-generation features.
This combination of advanced analytics and professional presentation tools empowers researchers to communicate findings more convincingly to policymakers, stakeholders, or fellow academics.
For Academics: A Transformational Learning and Teaching Tool
Academia thrives on clarity of explanation and the ability to connect theoretical knowledge with practical application. Witika F-Correlations v1.0 stands out as a transformative teaching and learning platform for both students and lecturers.
For students, the software simplifies the often-intimidating world of statistics. Instead of wrestling with complex coding or overwhelming statistical jargon, they can import data in common formats such as CSV and Excel, select variables, run analyses, and instantly generate results. This hands-on, interactive approach deepens understanding of statistical methods and enhances analytical confidence.
For lecturers and supervisors, the software provides a powerful demonstration tool. Concepts such as correlation, regression, clustering, PCA, and machine learning can be illustrated visually in real time during lectures or workshops. This not only improves student engagement but also bridges the gap between abstract theory and real-world application.
Moreover, for postgraduate students working on theses or dissertations, the software streamlines research workflows. With its time-series analysis support, advanced inference testing, and export capabilities, it equips them with the tools to produce results that meet academic standards. Ultimately, Witika F-Correlations v1.0 enhances academic productivity and raises the quality of research output.
For Corporate Professionals: Driving Data-Informed Decisions
In the corporate world, the difference between success and failure often lies in the ability to interpret data correctly and act on it swiftly. Witika F-Correlations v1.0 brings the power of advanced analytics to corporate professionals in a format that is intuitive and practical.
For managers, strategists, analysts, and consultants, the software provides a platform to analyze financial trends, customer behavior, operational efficiency, and market performance. Through interactive dashboards and diverse chart options, businesses can gain deeper insights into performance indicators and correlations that matter most for strategic decision-making.
Examples of corporate applications include:
Identifying the drivers of customer satisfaction or sales performance.
Mapping relationships between operational factors and productivity.
Evaluating risk factors through correlation and clustering analysis.
Presenting insights to executives or investors using professional, exportable visuals.
By simplifying complex analytics and ensuring results are easy to interpret, Witika F-Correlations v1.0 supports businesses in becoming truly data-driven organizations.
Unique Features that Set It Apart
What makes Witika F-Correlations v1.0 stand out is its blend of power, versatility, and simplicity. Key features include:
Multiple Correlation Methods: From basic Pearson to advanced partial and mutual information approaches.
Unique Visualization Suite: Over 30 chart types across categories like statistical plots, network graphs, clustering diagrams, machine learning outputs, and specialized visualizations.
Project Management Tools: Save, load, and export projects easily for continuity in long-term analysis.
Professional Export Options: Export charts and tables in multiple formats (PNG, PDF, HTML, CSV) for reports and presentations.
Time Series Analysis Support: Special functions for datasets involving chronological variables.
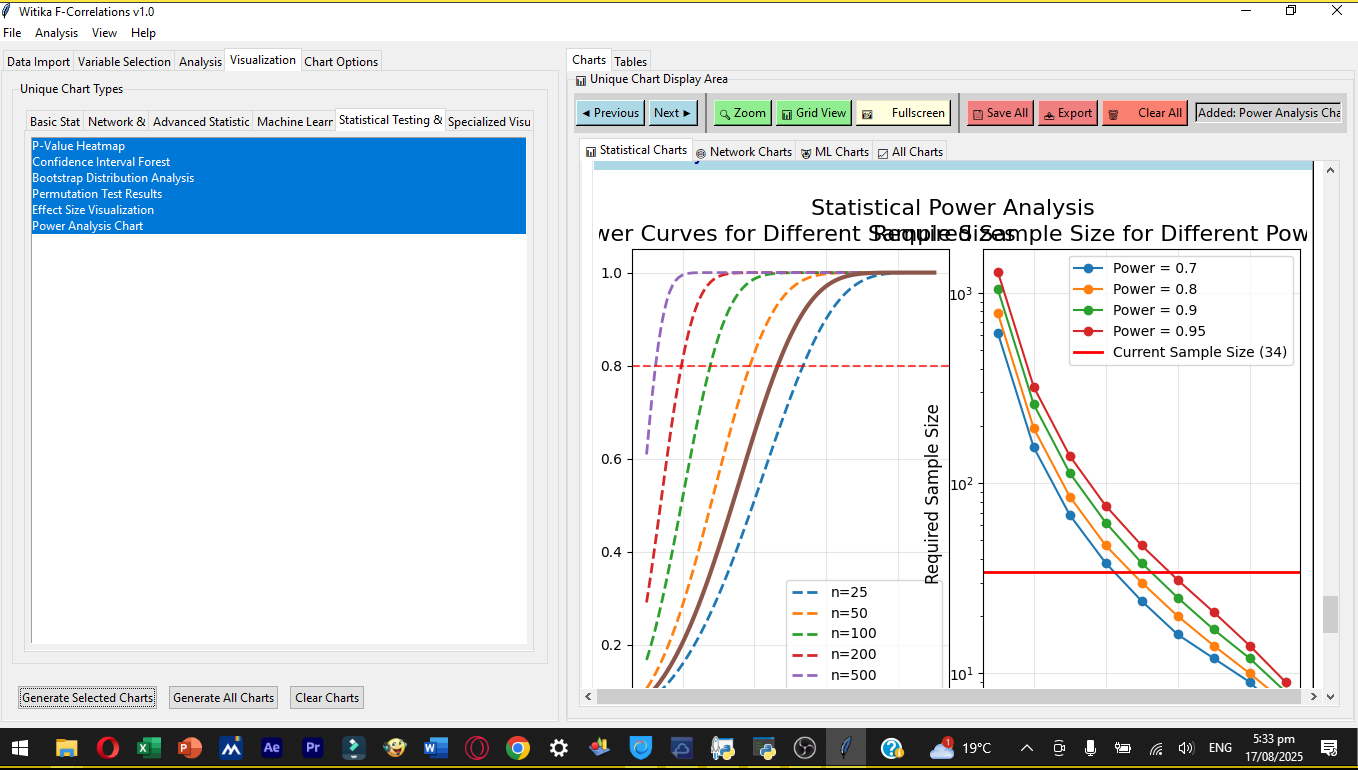
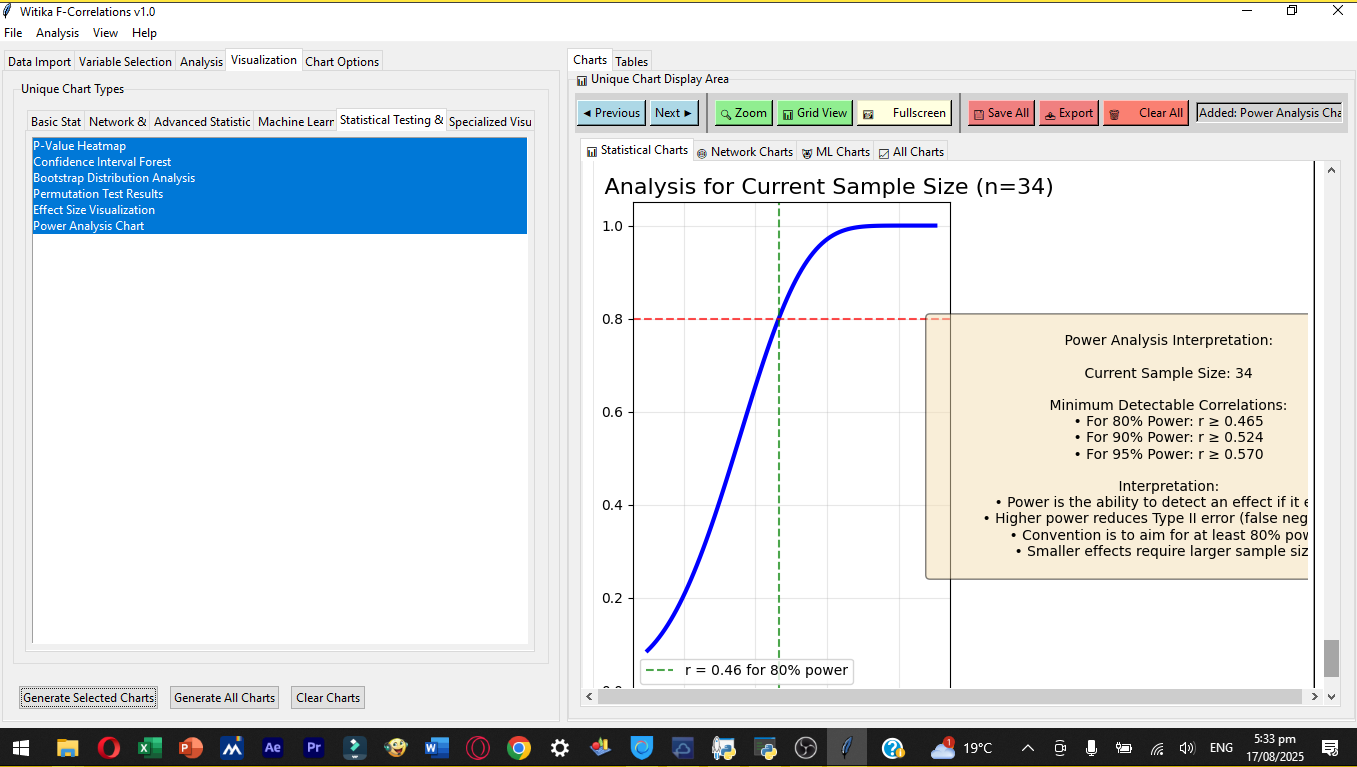
Statistical Testing & Inference: P-values, confidence intervals, bootstrapping, permutation tests, and power analysis.
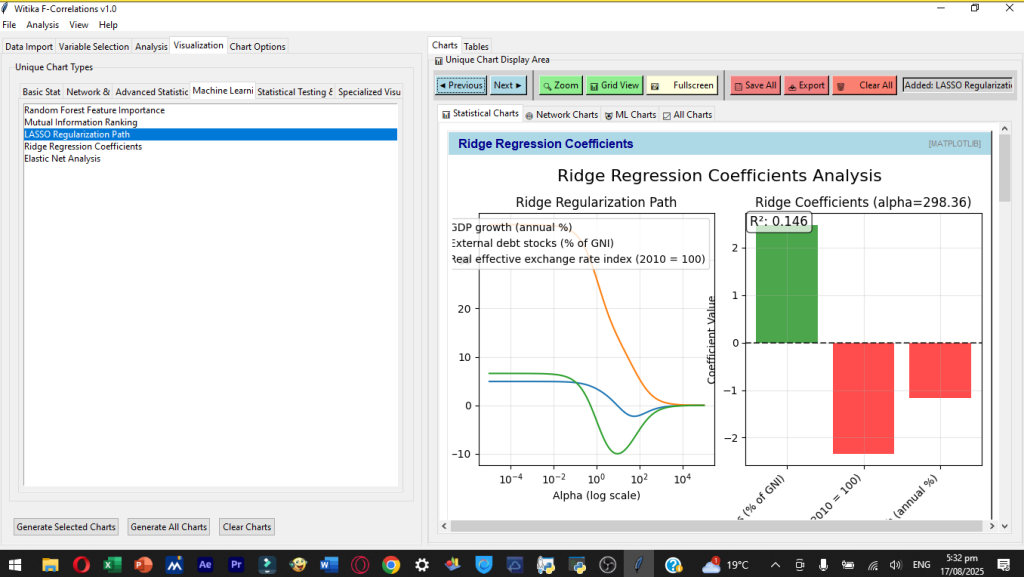
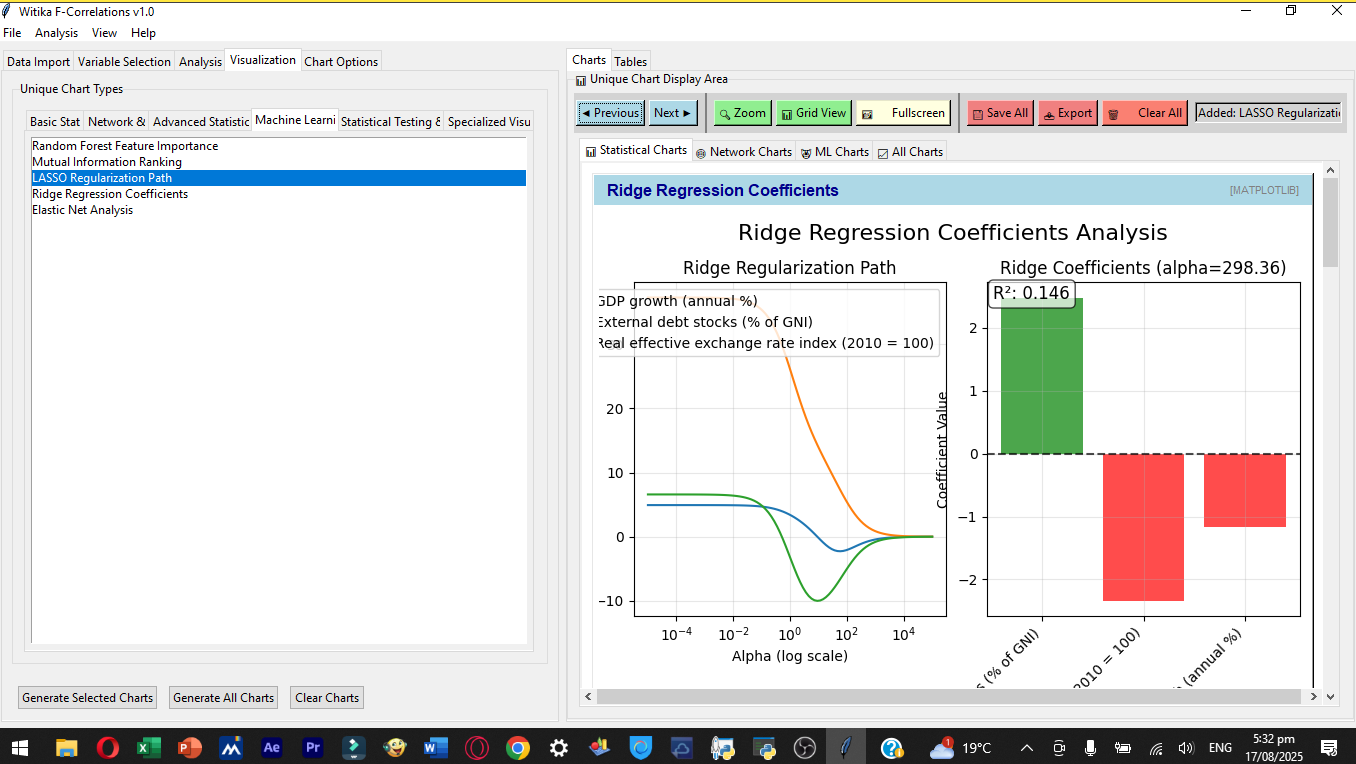
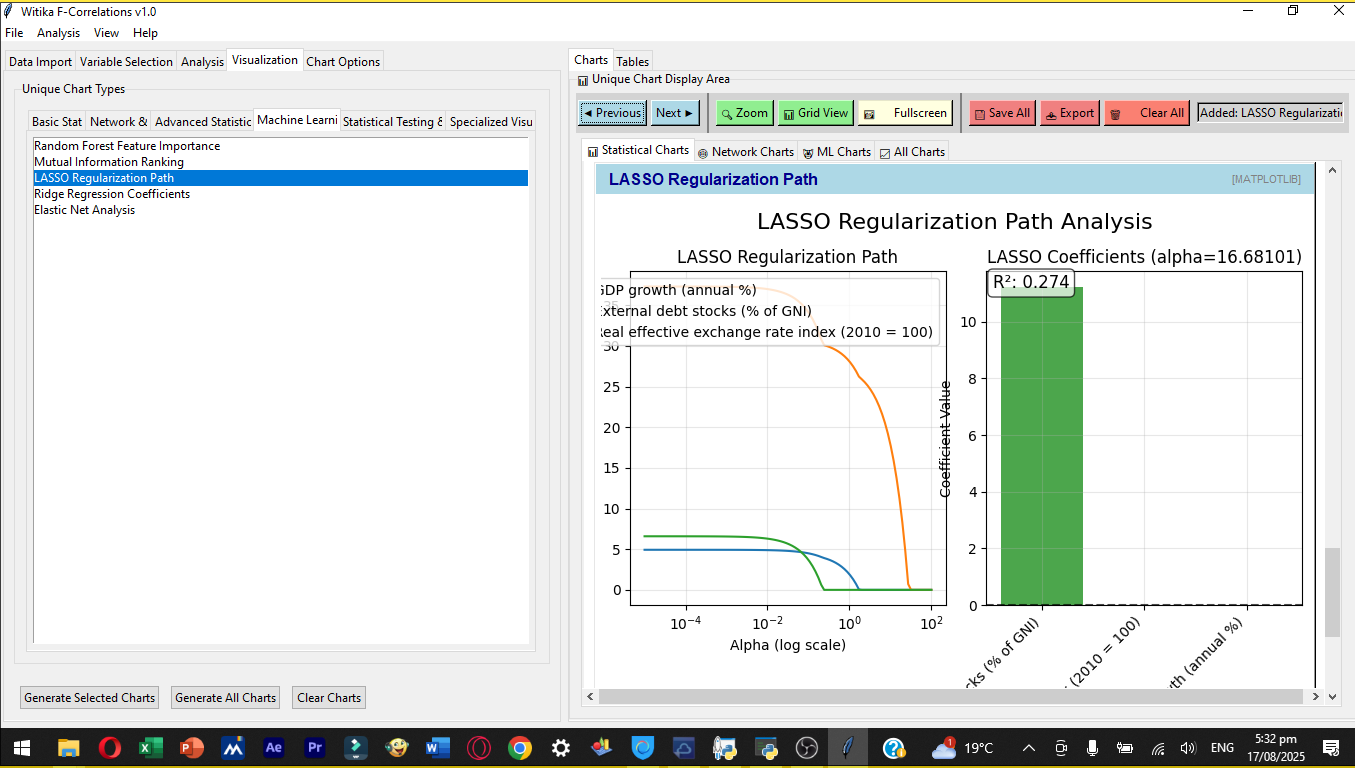
Machine Learning Integration: Random forest feature importance, regularization path visualizations, and clustering algorithms.
User-Friendly Interface: A polished Tkinter-based GUI that eliminates the need for coding knowledge while still providing advanced analytics.
Why Choose Witika F-Correlations v1.0?
For researchers, it ensures robust analysis and professional presentation of findings.
For academics, it simplifies teaching, enhances learning, and raises the quality of dissertations and theses.
For corporate professionals, it enables data-driven decision-making and impactful communication of insights.
In short, Witika F-Correlations v1.0 is not just software—it is a partner in discovery, learning, and strategy.
ACCESS TO FREE TRIAL VERSION!