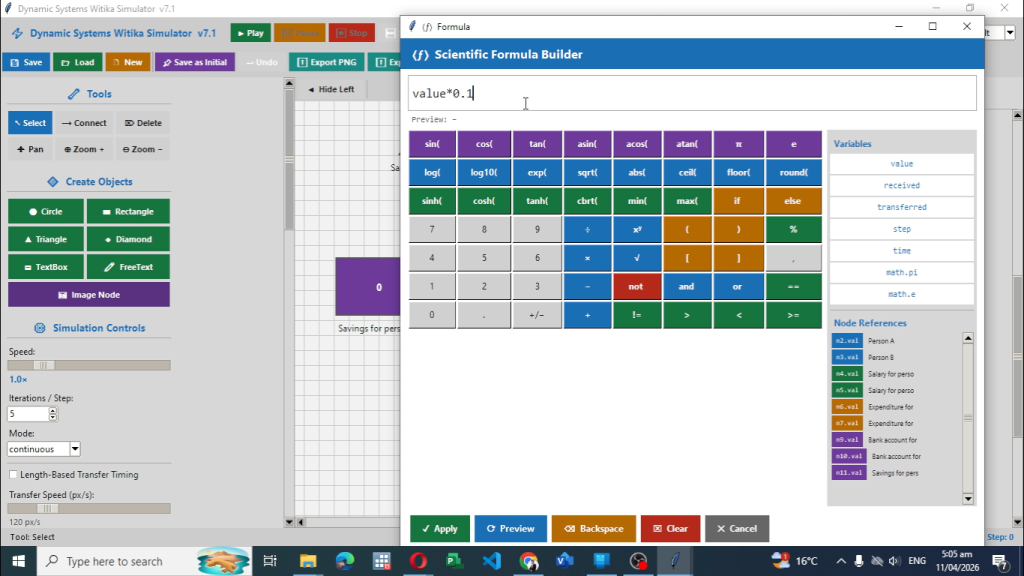
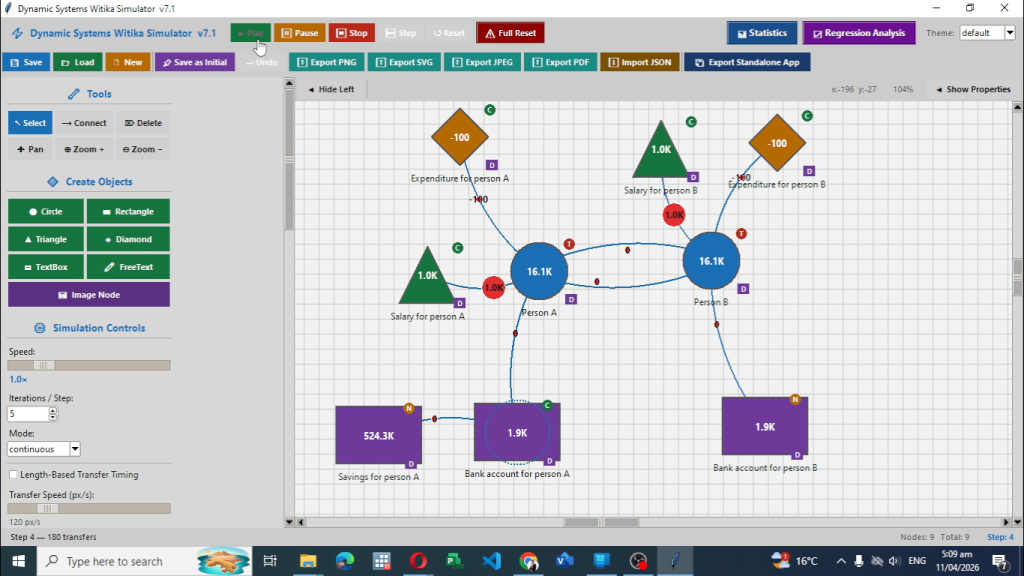
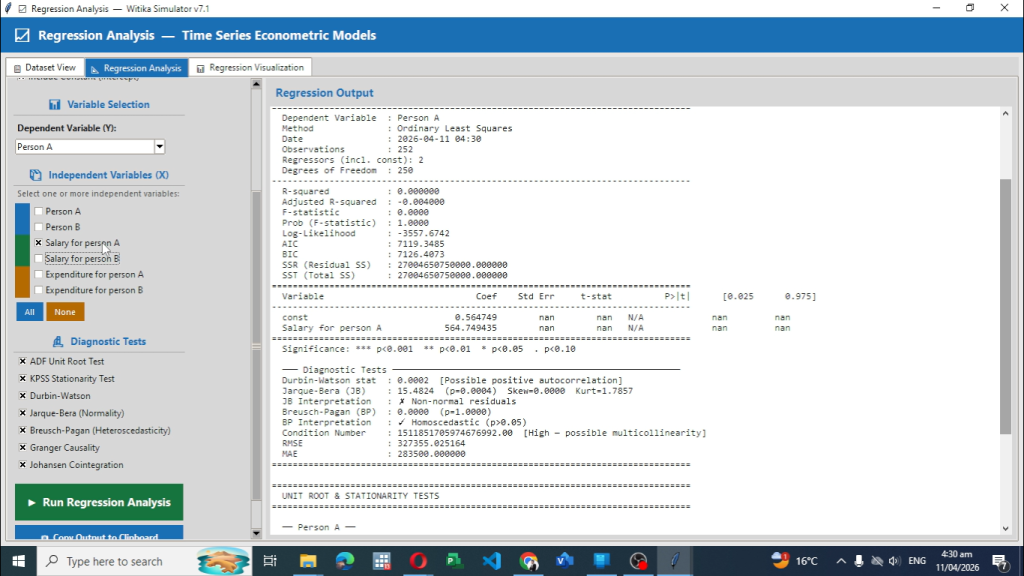
Dynamic Systems Witika Simulator v7.1 brings a complete visual environment for building, running and analysing interconnected systems. Users place nodes on a canvas, link them with any of 28 distinct connection styles, assign transfer rules and formulas, then watch values move in real time. The same workspace immediately supplies time-series data, diagnostic tests, regression models and customisable charts. Everything can be saved, exported as high-resolution images or turned into a self-contained standalone application that colleagues can run without installing the full simulator.
Academic value
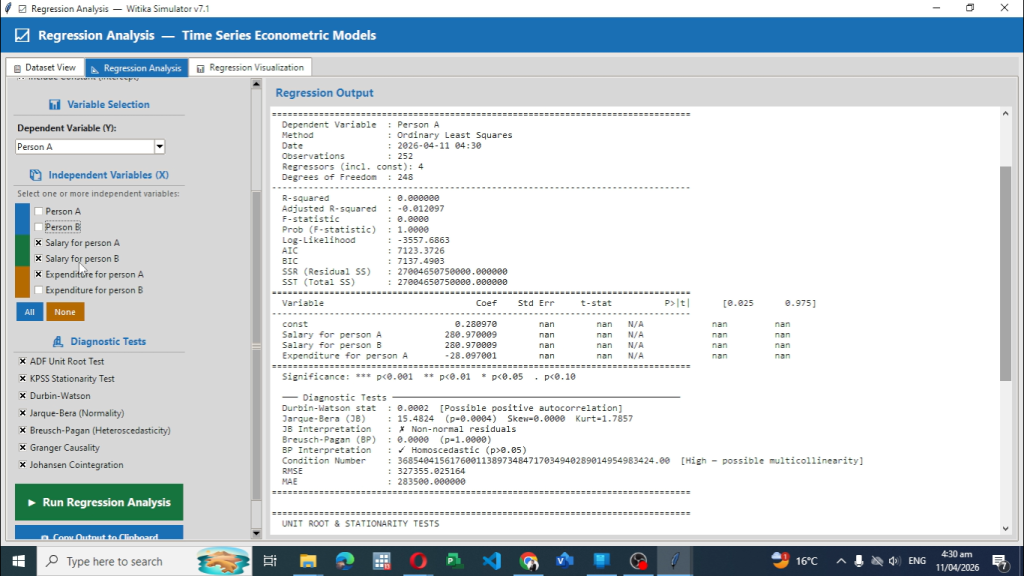
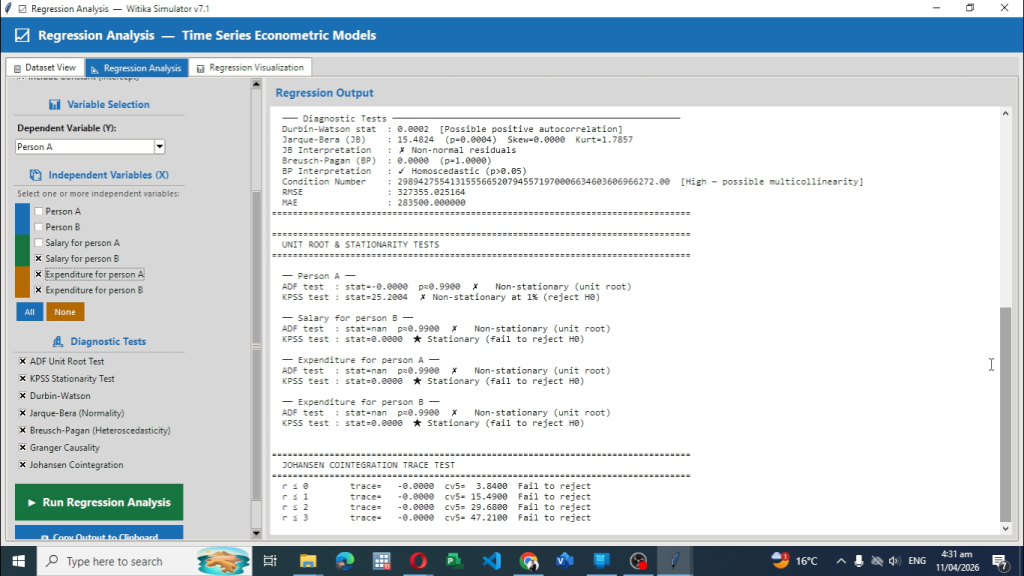
Universities and research institutes gain a single platform that spans teaching, student projects and publishable research. Lecturers in economics, systems dynamics, ecology or public health can construct live circular-flow, predator-prey or epidemiological models in minutes and let students alter parameters on the spot. The integrated econometric engine (OLS, rolling OLS, ARDL, VAR, VECM, Granger causality, Johansen cointegration, ADF, KPSS, Durbin-Watson, Jarque-Bera and Breusch-Pagan tests) turns every simulation into a ready-made data set for coursework or papers. Impulse-response functions, stationarity plots at multiple differencing orders, spectral analysis and a fully programmable chart library let researchers produce journal-quality figures without leaving the application. Standalone export means a finished model can be distributed to an entire class or uploaded as supplementary material.
Corporate value
Businesses use the same canvas to map supply chains, cash-flow networks, inventory loops or organisational information flows. Managers test “what-if” scenarios by changing transfer rates, adding delays or introducing stochastic probabilities and instantly see the impact on every node. Sensitivity analysis, leakage-injection balances and group-level metrics highlight bottlenecks and policy levers. Custom images can replace generic shapes so that a logistics map looks like the actual warehouse layout or a financial diagram uses company branding. The resulting visual reports and standalone executables become decision-support tools that non-technical executives can open and run themselves.
Policy-sphere value
Government ministries, central banks and international organisations can prototype closed- or open-economy circular-flow models, insert fiscal or monetary shocks and observe the transmission through households, firms, banks and the foreign sector. Time-mapping features convert simulation steps into months or years so that results align with official planning calendars. Cointegration and Granger tests supply statistical backing for policy briefs, while the About-window editor lets agencies embed official manuals, maps and photographs directly inside the distributed application. Policymakers therefore receive both an interactive laboratory and a polished communication product from one piece of software.
Trying the software is free of charge. You can run the full program until the trial version expires. After that you may subscribe for one month at K300 if you are a Zambian client or 50 US dollars if you are located outside Zambia. Payment method is open to discussion so that we can accommodate the channel you prefer. You may cancel the subscription at any time. Please subscribe to continue using this software.
For subscription assistance please contact us by email at resgroup@research-expert-solutions.com. Alternatively, for a prompt response, you can call or send us a WhatsApp message on +260 972 412 315.