FitzStatistics v4.3 — Advanced Desktop Statistical & Econometric Suite
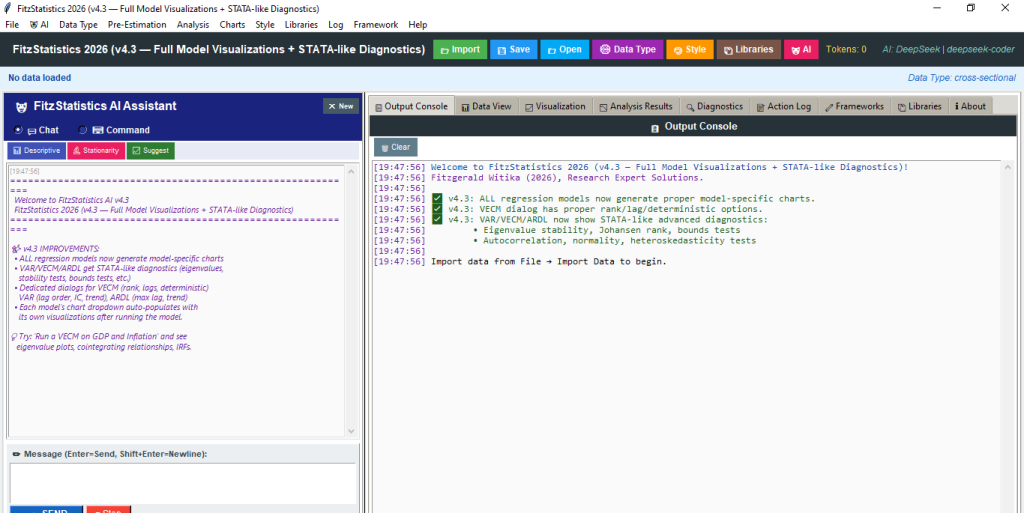
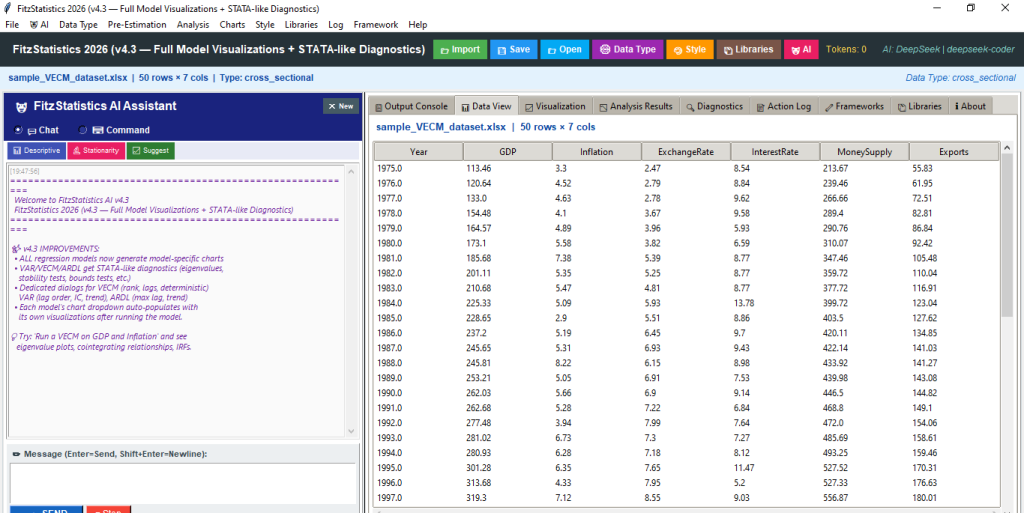
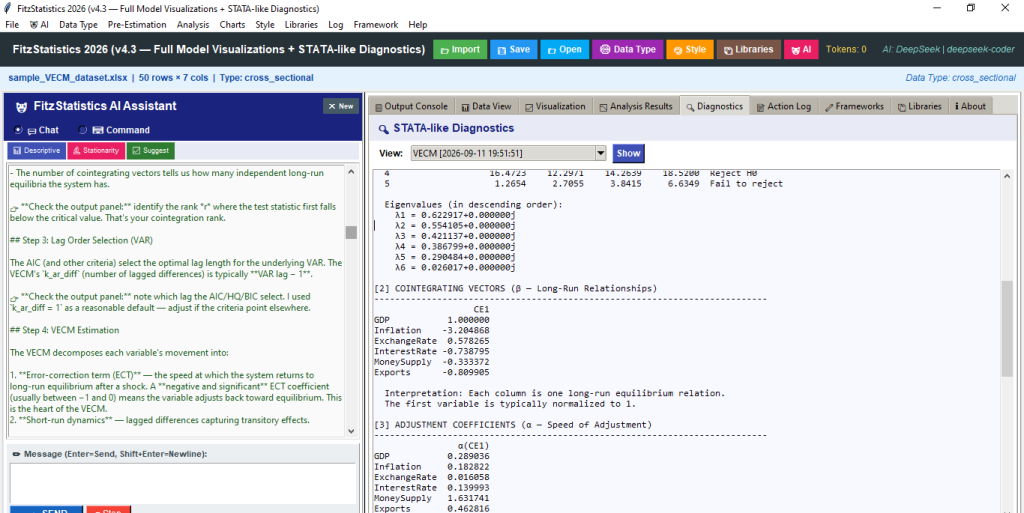
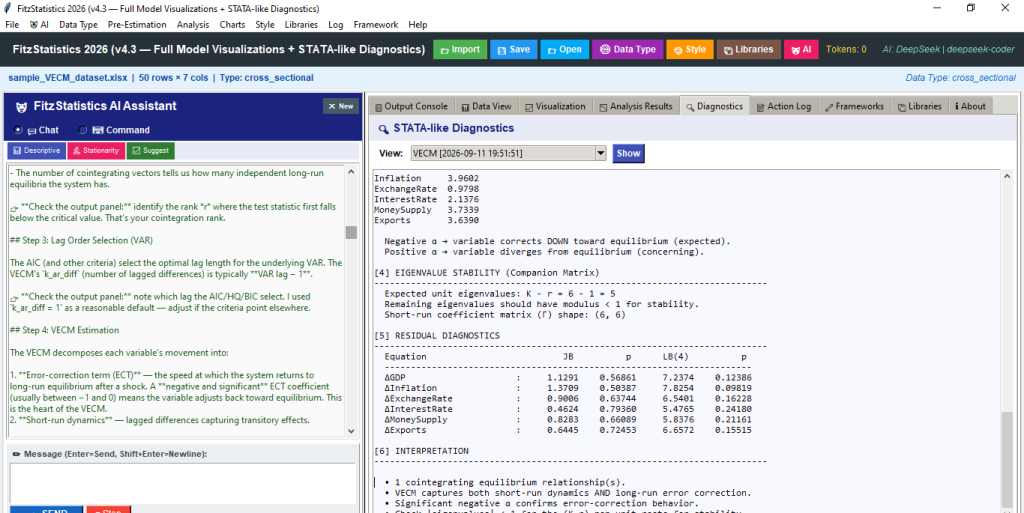
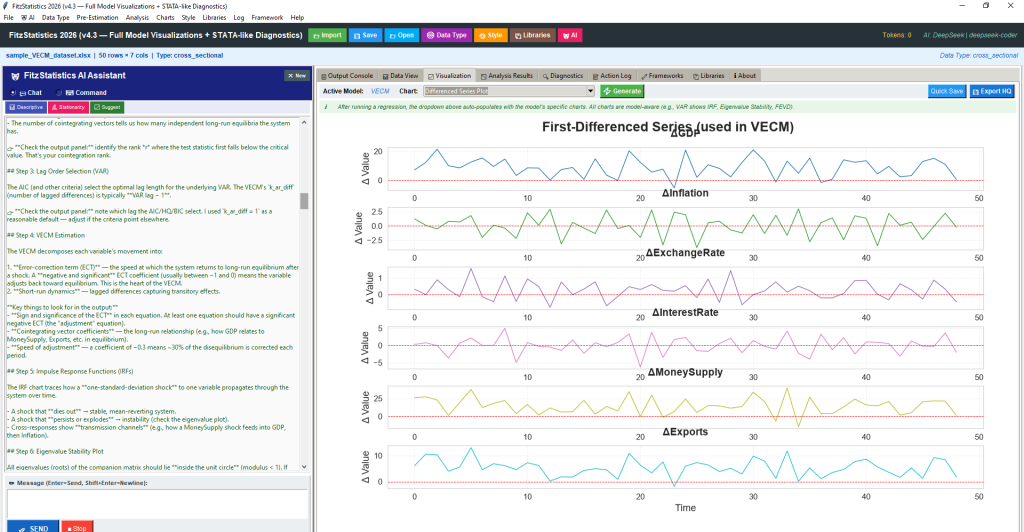
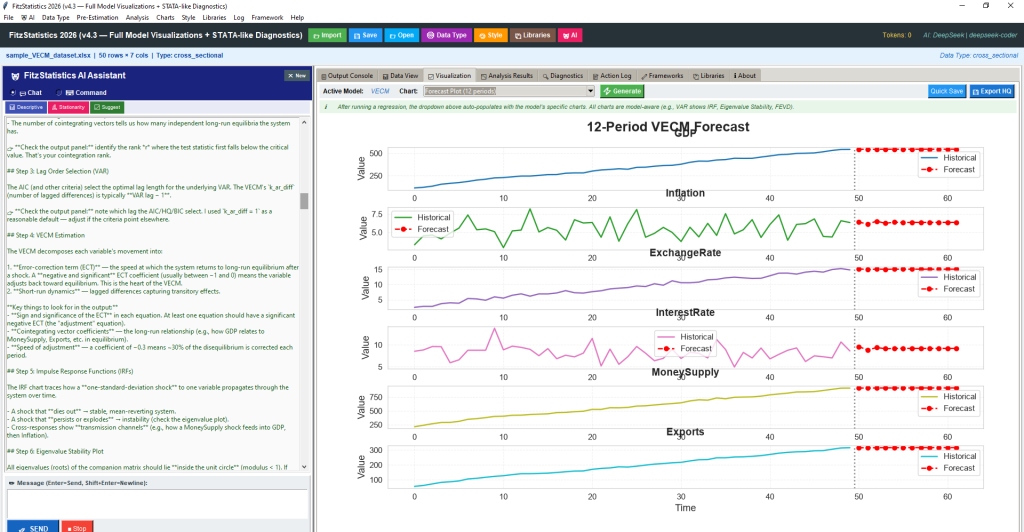
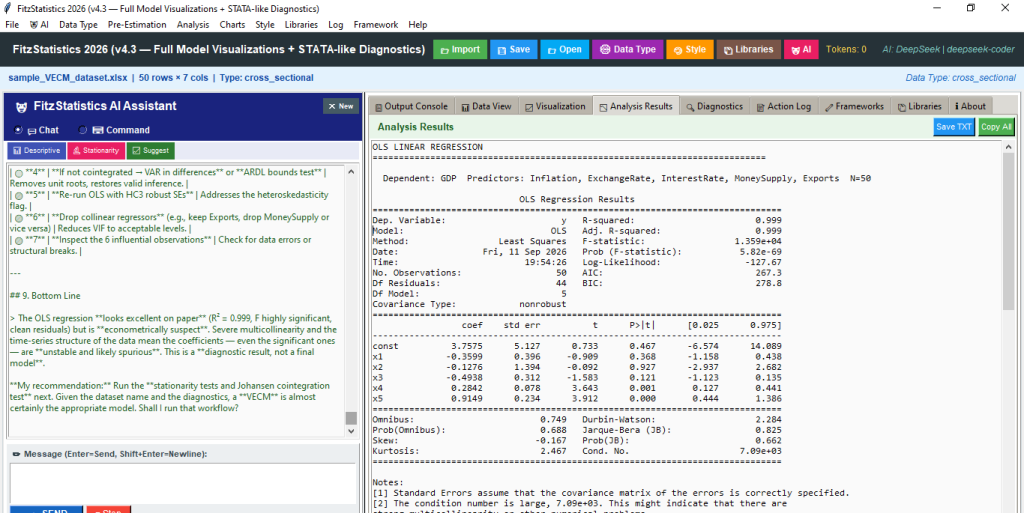
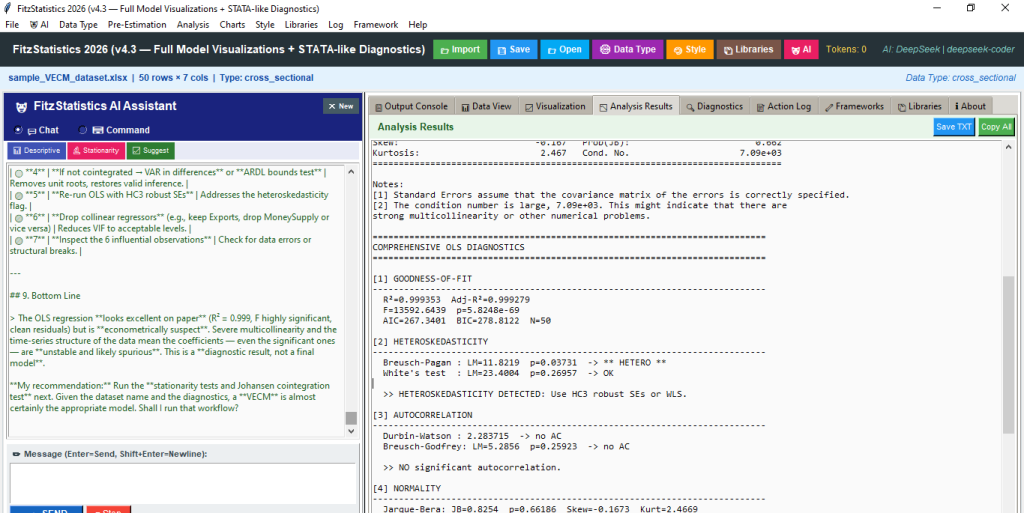
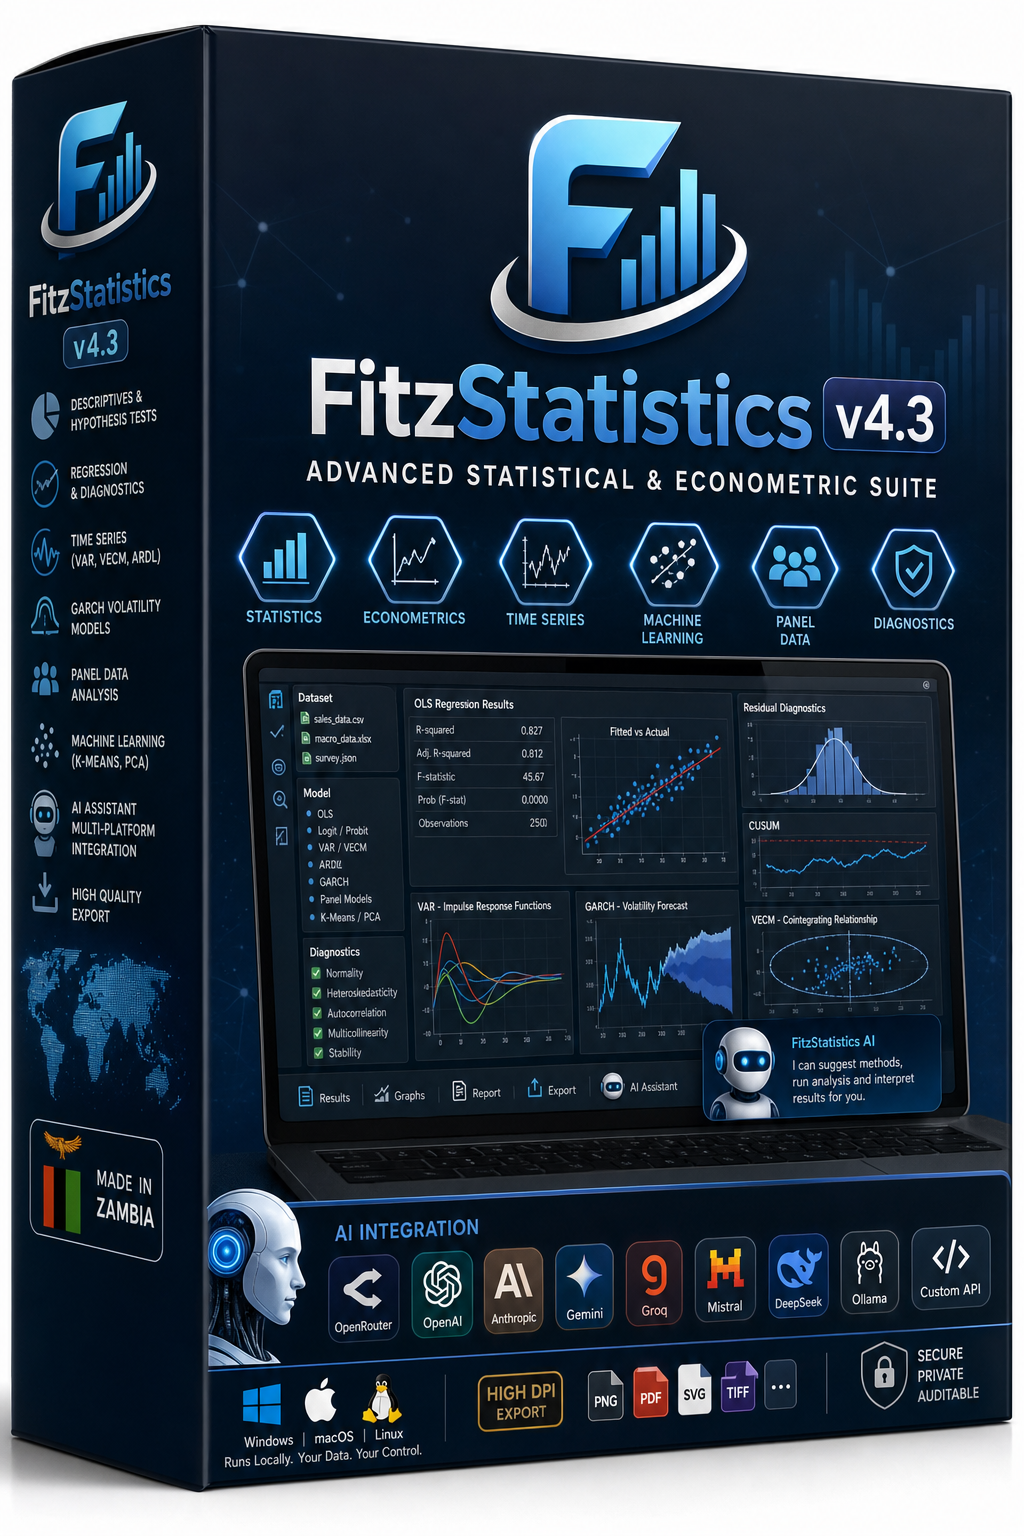
FitzStatistics is a professional desktop platform for statistics, econometrics and applied machine learning, with true multi-platform AI integration and STATA-style diagnostics. It is developed by Fitzgerald Witika (2026) at Research Expert Solutions, Lusaka, Zambia. You import CSV, Excel or JSON (or load sample datasets), set the data structure (cross-section, time series or panel), and run everything from descriptives and hypothesis tests through OLS, logit/probit, VAR, VECM, ARDL, ARCH/GARCH and panel models. Each model writes a full text report, fills a diagnostics pane, and auto-populates a chart list that is specific to that model (IRFs and eigenvalue stability for VAR; cointegrating relationships, Johansen tables and α/β plots for VECM; bounds-test visuals and CUSUM for ARDL; news-impact and volatility forecasts for GARCH, and so on). An embedded assistant named FitzStatistics can chat, suggest methods and execute analyses via structured action blocks, using OpenRouter, OpenAI, Anthropic, Gemini, Groq, Mistral, DeepSeek, local Ollama or a custom API. Reusable frameworks, an action log, custom Python libraries/charts and high-DPI export support teaching, consulting and publication. All analysis runs locally; API keys stay on the machine except when you choose to call a remote model.
Value to Academia
Lecturers and students get one environment that covers the undergraduate-to-MSc pipeline: Shapiro–Wilk, Jarque–Bera and Anderson–Darling; t-tests, ANOVA, Mann–Whitney, Wilcoxon, Kruskal–Wallis and chi-square; Pearson, Spearman and Kendall; OLS with HC3, VIF, RESET, Cook’s distance, CUSUM/CUSUMSQ and influence plots; binary logit/probit with ROC, calibration and marginal effects. Time-series courses can teach ADF/KPSS at levels and differences, Engle–Granger and full Johansen trace/max-eigenvalue tables (90/95/99% critical values), Granger causality, VAR lag selection (AIC/BIC/HQIC/FPE), eigenvalue stability, portmanteau tests and FEVD/IRF. VECM dialogs expose rank (auto or manual), lag differences and deterministic terms (n, co, ci, lo, li, cili, colo). ARDL includes Pesaran–Shin–Smith bounds critical values and long-run multipliers. ARCH/GARCH cover Engle’s ARCH-LM, Ljung–Box on squared standardised residuals and the news-impact curve. Panel options include fixed effects, random effects and pooled OLS (via linearmodels). K-means and PCA support unsupervised modules. Chart-style presets (screen, Word, large Word, PowerPoint, journal 300–600 dpi) produce figures suitable for theses and journals. Frameworks turn a logged sequence into a reusable pipeline so methods courses can standardise “load → stationarity → cointegration → VECM → IRF” without rewriting scripts. AI interpretation after each run helps students move from output to plain-English findings, while the command mode remains fully auditable.
Value to the Corporate World
Banks, consultancies, utilities and research units can map drivers of sales, risk, inflation or operations without stitching Excel, EViews and a notebook. Robust OLS and binary models support credit, churn and campaign analysis; VAR/VECM support macro and market systems; GARCH supports volatility and risk; panel models support multi-branch or multi-period staff and customer data. The Dataset view, action log and project files (.fzp) support handover and audit. Highlight-style chart control, live preview and HQ export (PNG, PDF, SVG, JPEG, TIFF, EPS) feed board packs and client reports. Custom libraries let in-house teams add proprietary tests and charts that persist across sessions. AI can propose a specification, run it and interpret residuals, while you keep final sign-off. Optional local Ollama avoids sending data off-site. Frameworks encode a house style (for example “always run VIF, BP, BG and RESET after OLS”) so junior analysts follow the same path. Token usage and connection tests make AI cost and reliability visible.
Value to the Policy Sphere
Ministries, central banks, statistical offices and NGOs can import survey or official series, declare time or panel structure, and document pre-tests before any structural claim. Stationarity batteries, Johansen rank, bounds tests and Granger matrices give a formal basis for “these series move together” or “this instrument leads that outcome.” Split-style thinking is supported by choosing subsets and re-running the same framework. Diagnostics (heteroskedasticity, autocorrelation, residual normality, CUSUM) are written in decision language, not only p-values. Cross-model charts (equilibrium errors, adjustment speeds, IRFs, volatility clusters) help non-specialists see dynamics. Everything can be exported as text, figures and JSON-style logs for peer review and parliamentary annexes. Local execution plus explicit parameters (lags, rank, trend, robust SEs) support reproducibility and public-sector audit.
Trying the software is free of charge. Clients can run the software for free until the expiry of the Trial version. That is when they can decide to subscribe to use the software for a Month at K300 for Zambian clients and $50 for clients from foreign countries. The payment method is open to discussion with the client, considering that clients would prefer different payment methods. They can cancel their subscription at any time. Please subscribe to continue using this software.
For subscription assistance, please contact us by email at resgroup@research-expert-solutions.com. Alternatively, for a prompt response, you can call or send us a WhatsApp message on +260 972 412 315.