
Stevanialysis v2.2 — Ultra-Advanced Statistical Network Analysis
Stevanialysis is a desktop platform for turning survey and tabular data into interactive statistical networks. It treats variables, response categories and individual respondents as nodes, and associations (Pearson, Spearman, Kendall, Cramér’s V, chi-square, phi, point-biserial) as weighted edges. Version 2.2 adds multi-variable respondent connections: each respondent ID appears once and is linked, with colour-coded edges, to data-point nodes from several variables at the same time, instead of being duplicated under every variable. Researchers can import CSV or Excel files, detect variable types, split networks by category, highlight nodes and edges by value or weight, drop variables or categories, compare blocks with Jaccard and structural metrics, and export diagrams and reports. Everything runs locally; data stay on the user’s machine unless they choose to export.
Value to Academia
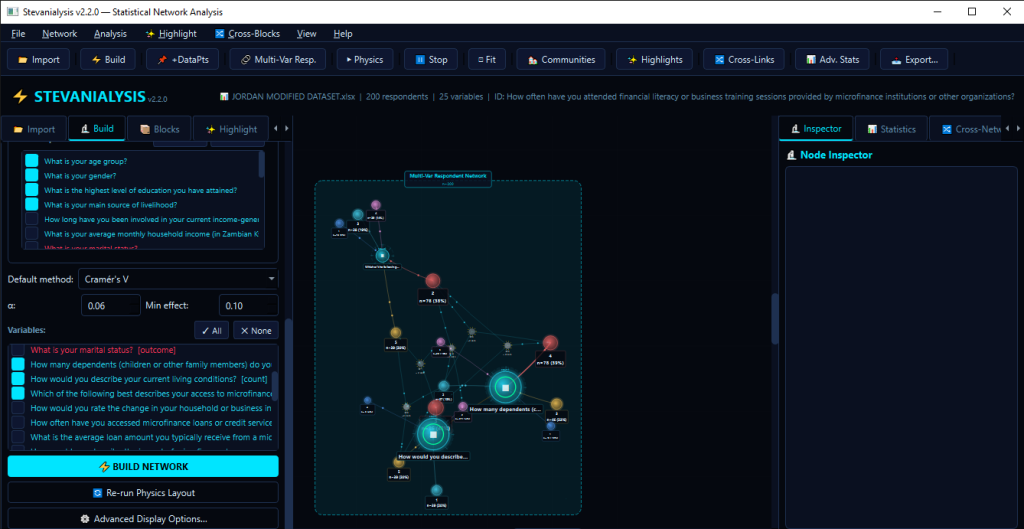
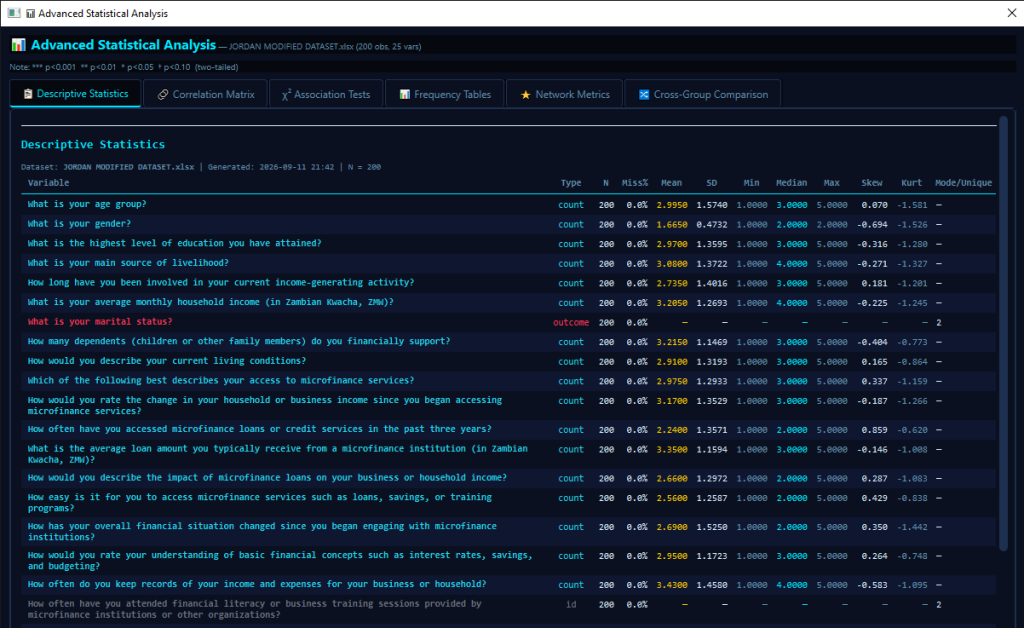
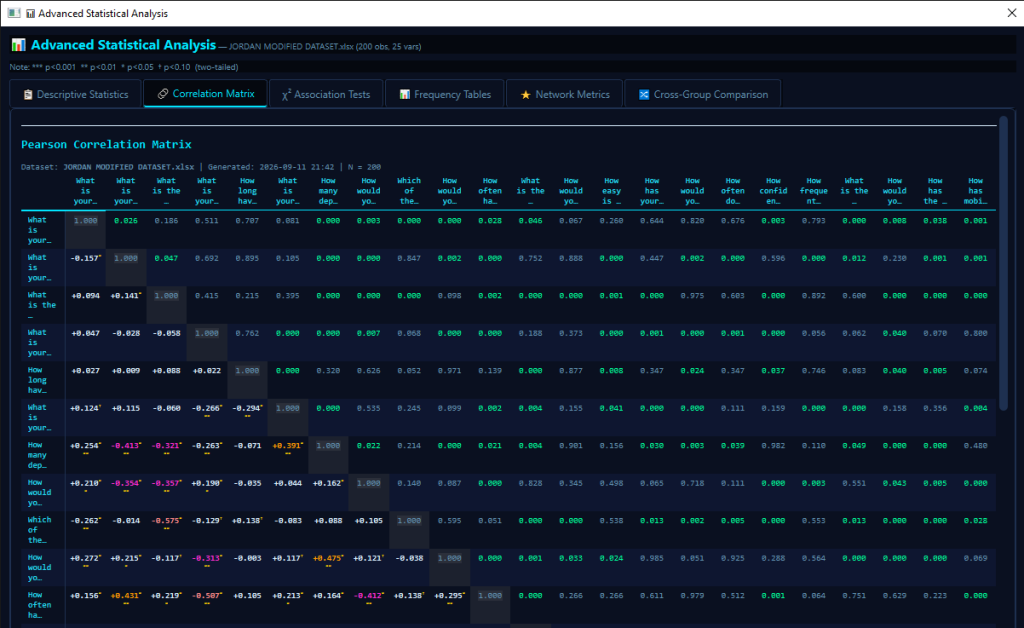
Stevanialysis gives lecturers and students a single environment for measurement, association testing and network visualisation. After import, the software classifies columns (continuous, binary, categorical, ordinal, count, outcome, ID), computes descriptives (mean, SD, skewness, kurtosis, frequencies) and builds association matrices with p-values and effect-size interpretation. The network canvas shows variables, data-point nodes (with counts and percentages) and optional respondent nodes. Multi-variable respondent mode is useful for teaching how one person sits at the intersection of several attributes (for example gender, education and region) without inflating the graph. Split-by-category networks support subgroup comparison (Jaccard similarity, density, clustering, centrality). Advanced statistics dialogs produce HTML/CSV reports suitable for dissertations and papers. Graph metrics (degree, betweenness approximation, closeness, clustering, community detection) sit alongside classical tests, so courses in statistics, psychometrics and social-network analysis can move from raw data to publication-ready figures without leaving the application.

Value to the Corporate World
Organisations that run employee, customer or stakeholder surveys can use Stevanialysis to map how answers cluster and how individual respondents connect across themes. The Dataset Viewer and Respondent Analysis dialogs support search, filter and profile lookup. Highlight rules mark specific values or strong edges; drop rules remove variables or categories before rebuild. Force-directed, circular, grid, radial and random layouts, plus themes (Sci-Fi Dark, Light, Ocean, Grey, Midnight), make it easy to produce board-ready diagrams. Export to PNG, JPEG, SVG and JSON supports reports and presentations. Multi-variable respondent links help show, for example, how the same employee relates to several satisfaction or demographic items in one view. Data never leave the workstation except when the user exports, which supports confidentiality and internal audit.

Value to the Policy Sphere
Policy analysts can import large surveys, split networks by region, income or other categories, and compare structure across groups (shared vs unique edges, proportion differences, centrality). Cross-block links (association, data-point difference, top-centrality) visualise how the same concepts behave in different subpopulations. Frequency tables, chi-square tests and Cramér’s V give a formal basis for claims about independence or association. Highlighting and legend overlays make it straightforward to communicate “who answered what” and “which links are strong” to non-specialists. Local execution and explicit rules (thresholds, drop lists, highlight criteria) support reproducible, auditable analysis for public-sector and NGO work.
Trying the software is free of charge. Clients can run the software for free until the expiry of the Trial version. That is when they can decide to subscribe to use the software for a Month at K300 for Zambian Clients and $50 for clients from foreign countries. The payment method is open to discussion with the client considering that clients would prefer different payment methods. They can cancel their subscription at any time. Please subscribe to continue using this software.
For subscription assistance, please contact us by email at resgroup@research-expert-solutions.com. Alternatively, for a prompt response, you can call or send us a WhatsApp message on +260 972 412 315.
We look forward to assisting you.