Witika Economic Design
Software Overview
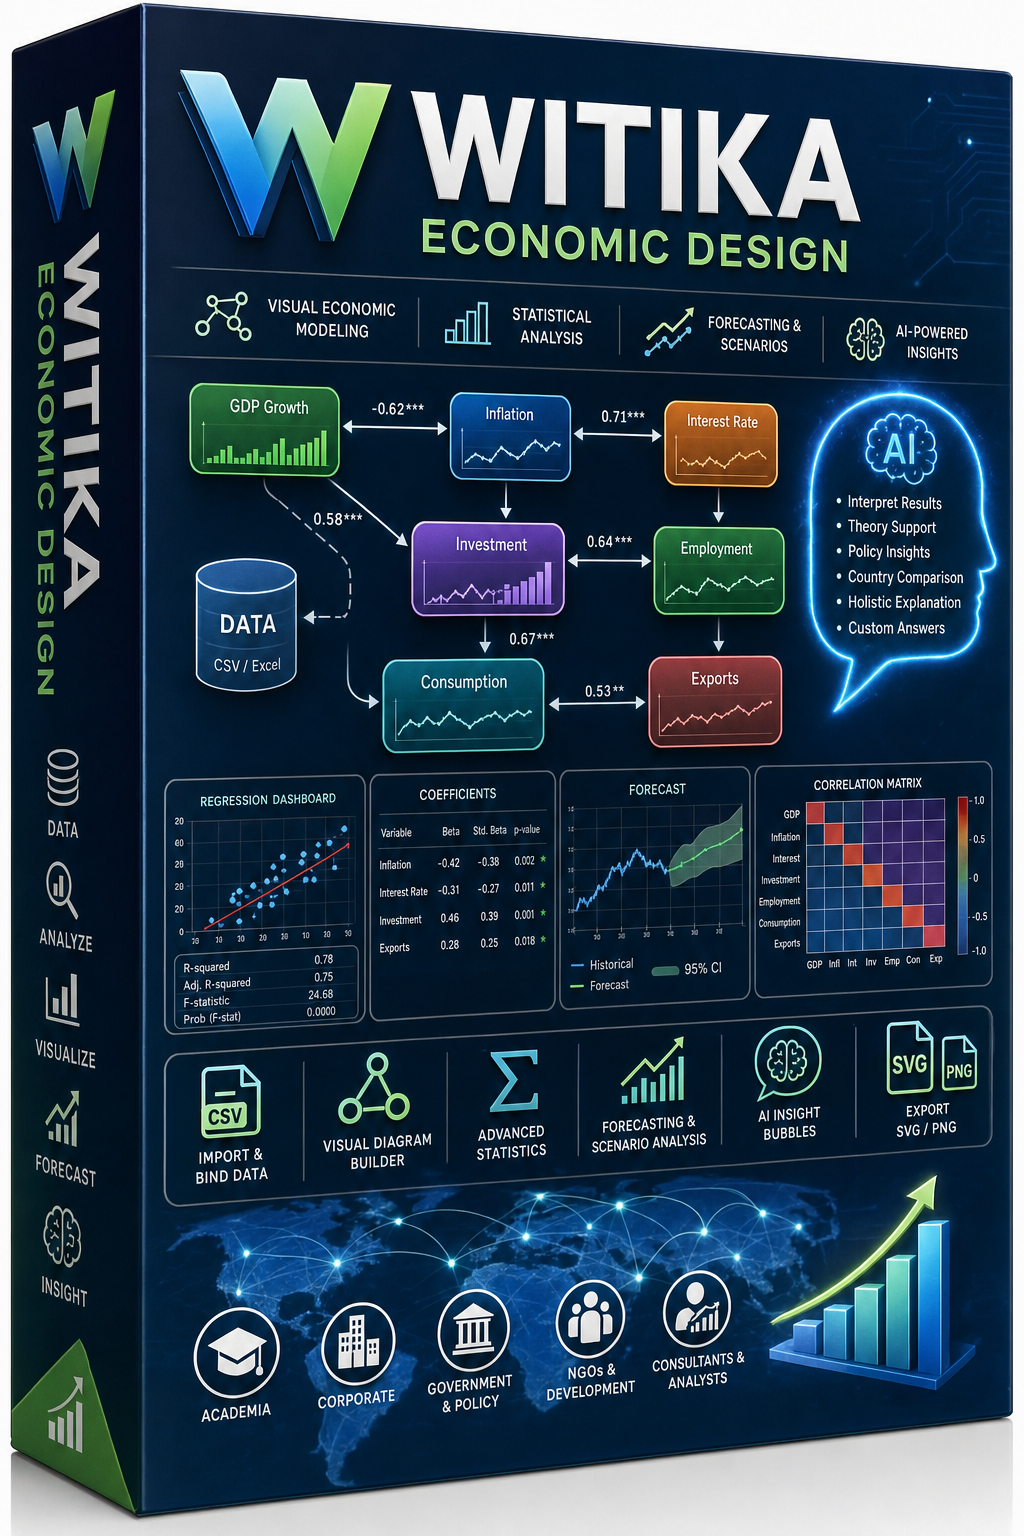
Witika Economic Design is an advanced economic modelling, statistical analysis, visualization, forecasting, and AI-assisted interpretation software designed for researchers, academics, corporate analysts, consultants, policymakers, students, and institutions that work with economic, financial, social, policy, and business data.
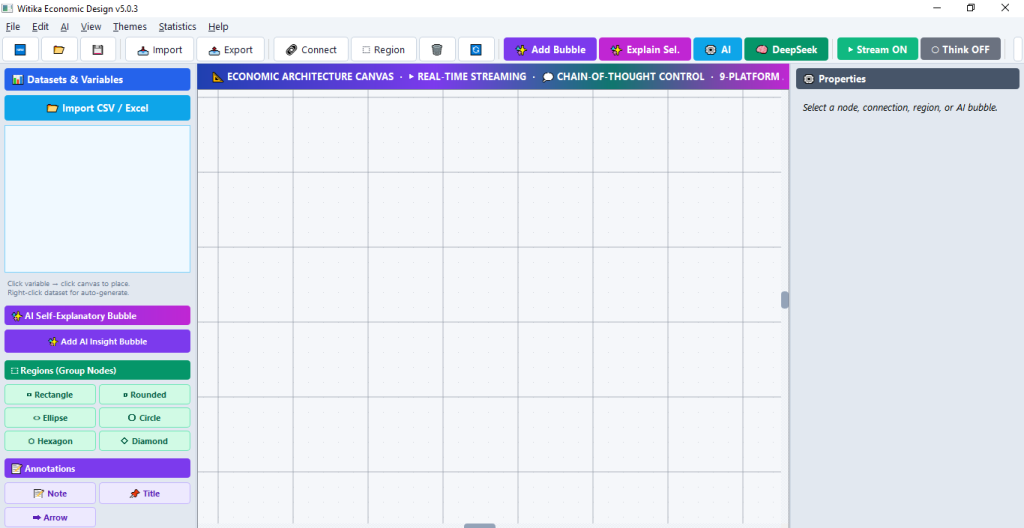
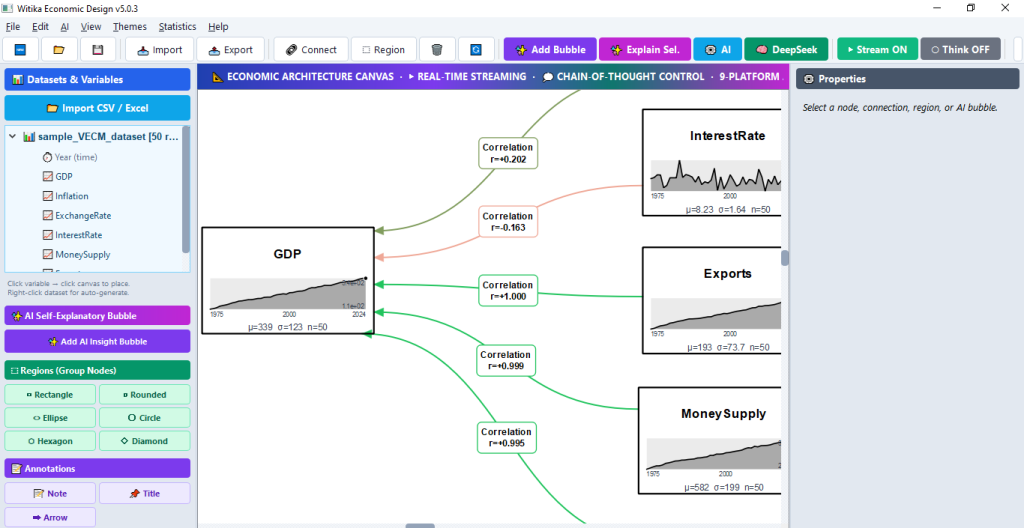
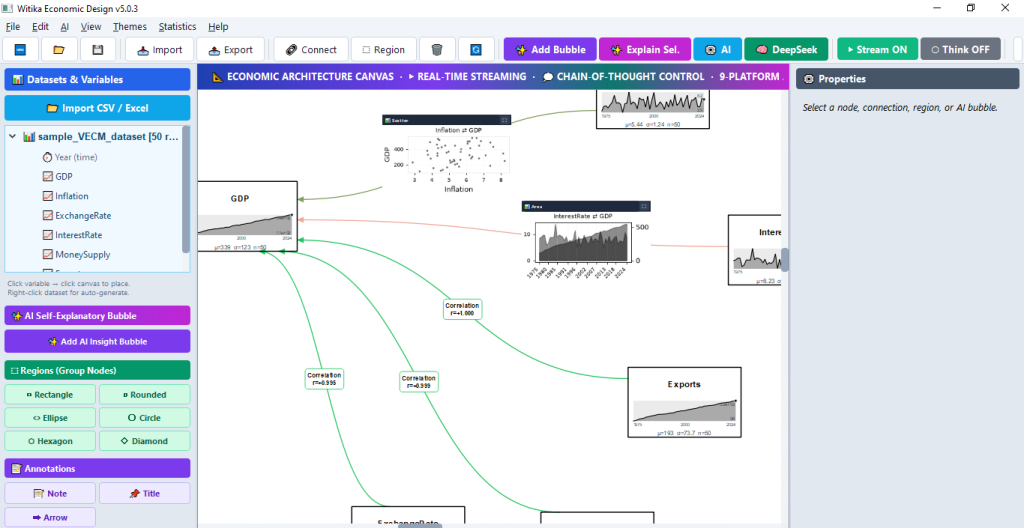
The software allows users to import datasets, create visual economic architecture diagrams, connect variables, run statistical tests, perform regression analysis, generate forecasts, visualize relationships, group variables into analytical regions, and produce AI-supported explanations directly within the diagram. It is especially useful for users who want to move beyond ordinary spreadsheet analysis and develop clear, evidence-based visual models that can support research, policy design, business strategy, academic publication, and executive decision-making.
Witika Economic Design helps users transform raw data into an interactive analytical system where variables are represented as nodes, relationships are represented as connectors, and results are displayed visually in a way that is easy to understand, explain, export, and present.




Value to Academia
For universities, researchers, lecturers, postgraduate students, and academic institutions, Witika Economic Design provides a powerful environment for conducting quantitative research and presenting findings in a structured visual format. Users can import CSV or Excel datasets, create nodes for variables, connect dependent and independent variables, run correlation and regression analysis, test statistical relationships, and generate interpretable outputs that support thesis writing, journal articles, research reports, and classroom teaching.
The software is useful for economics, business, finance, development studies, public policy, statistics, social sciences, education, and health research. It allows users to visually map theories, hypotheses, conceptual frameworks, empirical relationships, and statistical results. This makes it easier for researchers to explain how variables interact and how empirical evidence supports or challenges theoretical expectations.
Witika Economic Design also supports multiple regression, t-tests, ANOVA, group statistics, moderation analysis, correlation matrices, Granger causality, confidence intervals, standardized beta coefficients, significance indicators, effect sizes, and forecasting. These features make it suitable for both exploratory analysis and formal empirical modelling.
A major academic advantage is the built-in AI insight bubble system. Researchers can attach AI explanation bubbles to specific variables, connections, regions, or entire diagrams. These bubbles can generate interpretations of statistical results, theoretical explanations, policy implications, country comparisons, holistic system explanations, and custom research responses. This helps researchers improve the clarity of their analysis and communicate findings more effectively.

Value to the Corporate World
For companies, banks, consulting firms, NGOs, market analysts, and business intelligence teams, Witika Economic Design provides a practical tool for understanding the relationships between business indicators, market variables, operational data, financial performance, customer trends, and macroeconomic conditions.
Corporate users can use the software to analyse how sales, costs, inflation, exchange rates, interest rates, demand, employment, credit, prices, production, imports, exports, and other indicators interact over time. The diagram-based interface allows teams to build clear decision models that show how one variable influences another. This makes it easier to explain findings to executives, board members, clients, and project teams.
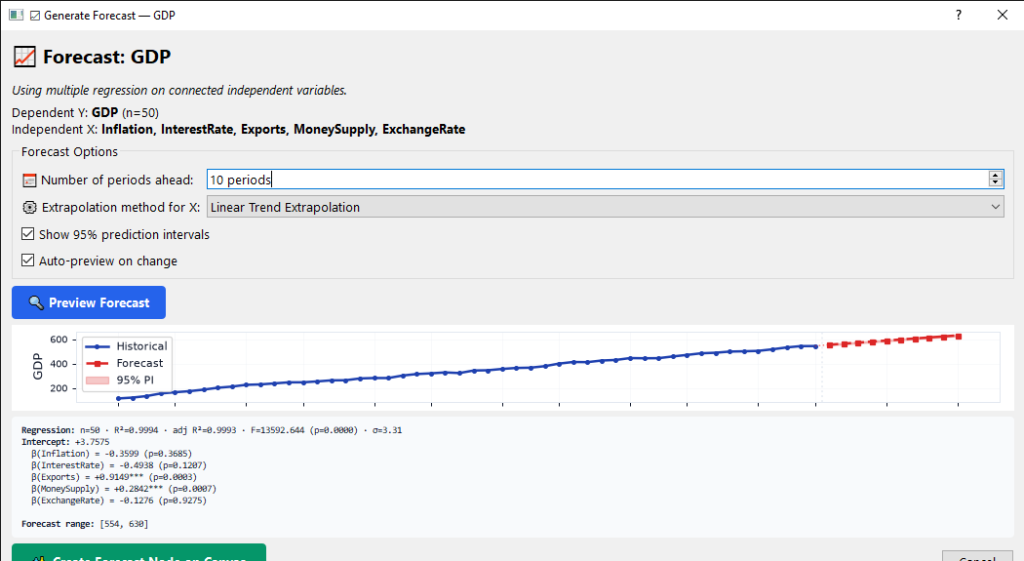
The software supports visual forecasting, allowing users to generate forecast nodes based on multiple regression models and connected predictor variables. This is useful for scenario planning, investment analysis, market forecasting, risk assessment, demand projections, and performance monitoring.
The embedded charts, mini visualizations, regression dashboards, export features, and AI-generated explanations make Witika Economic Design valuable for corporate reporting. Users can export diagrams as SVG or PNG files and use them in presentations, reports, strategy documents, business cases, and client deliverables.

Value to the Policy Sphere
For government ministries, policy analysts, development agencies, think tanks, regulators, and public sector institutions, Witika Economic Design offers a strong platform for evidence-based policy analysis. Policymakers often need to understand how economic and social variables interact, and this software helps make those relationships visible, measurable, and explainable.
The software can be used to analyse policy issues such as inflation, unemployment, GDP growth, public debt, exchange rates, poverty, taxation, trade, agricultural productivity, education outcomes, health indicators, banking sector performance, and public expenditure. By creating variable nodes and connecting them through statistical relationships, policy teams can identify patterns, dependencies, causal signals, and possible intervention points.
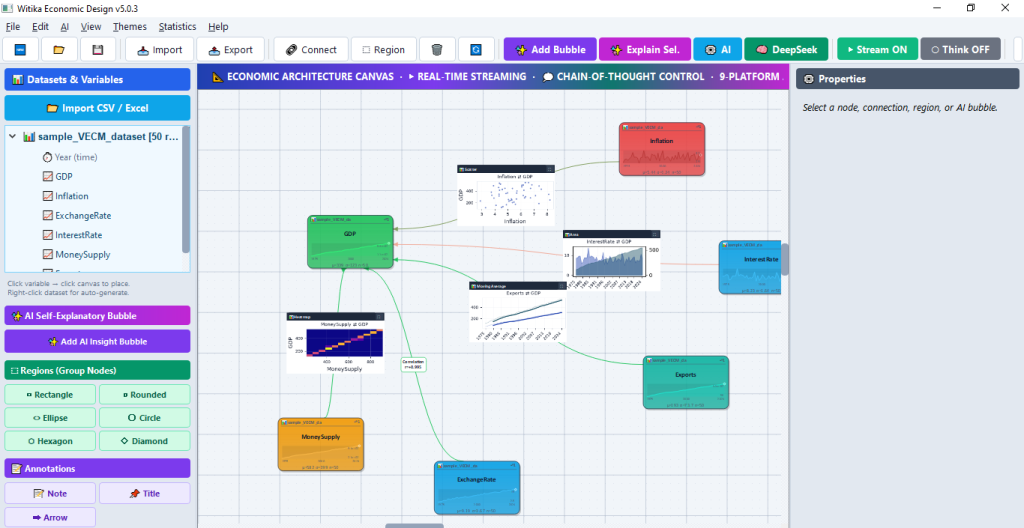
The region feature allows users to group variables into thematic areas such as monetary policy, fiscal policy, agriculture, trade, labour markets, financial stability, or social development. Users can then run region-level analysis and display results directly on the diagram.
The AI policy recommendation feature is especially useful for the policy sphere. It can generate plain-language explanations, policy recommendations, country-specific comparisons, and holistic system interpretations based on the data and model structure. This helps bridge the gap between technical statistical outputs and practical policy decision-making.
Key Features
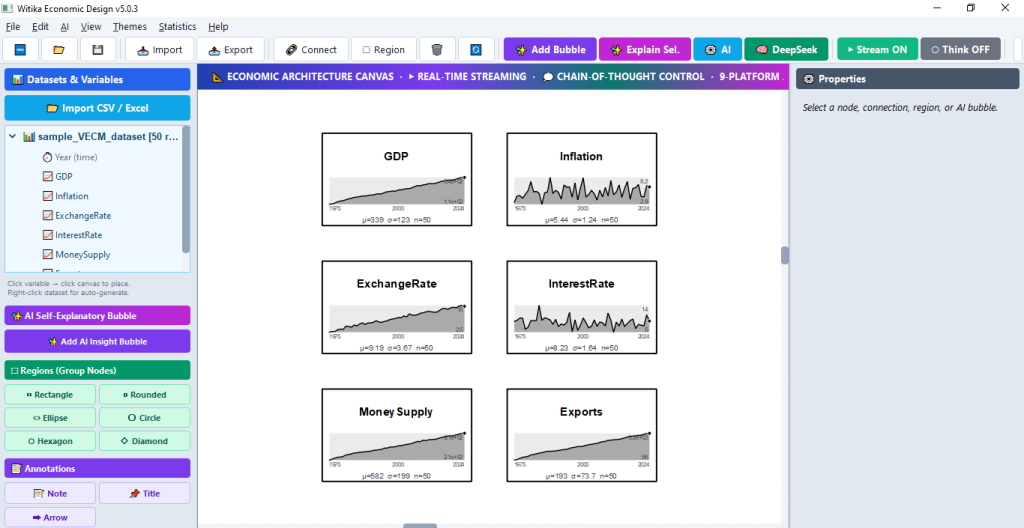
Witika Economic Design includes a wide range of features designed to support serious analytical work. Users can import CSV and Excel datasets, preview datasets, preview individual variables, automatically generate variable nodes, and bind data directly to diagram elements.
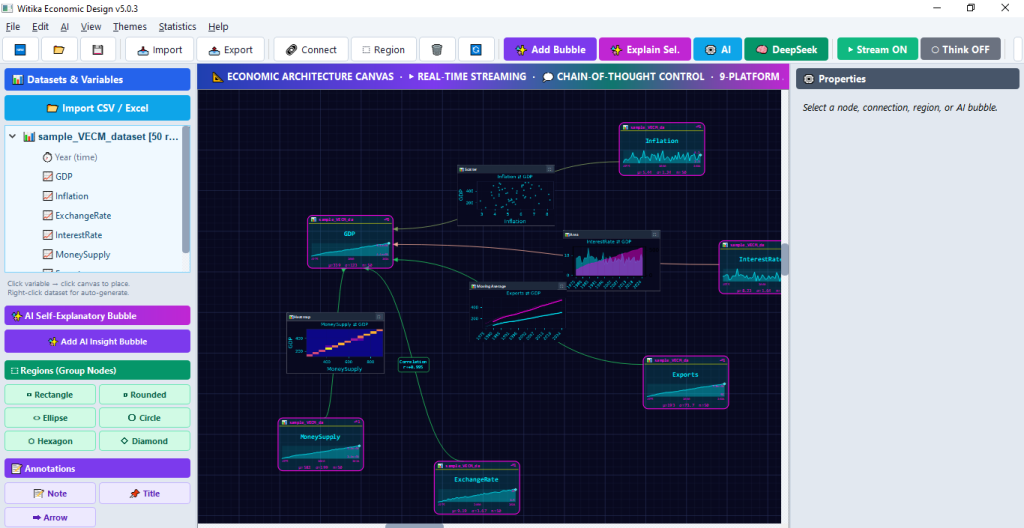
The software supports visual economic modelling through nodes, connectors, regions, annotations, and AI insight bubbles. Variables can be displayed with sparklines, time labels, summary statistics, and custom shapes. Users can choose from many visual themes including modern professional, academic paper, corporate, blueprint, engineering, scientific journal, textbook, dark studio, structural SEM, flow diagram, and minimalist styles.
The statistical engine supports Pearson correlation, Spearman correlation, Kendall correlation, covariance, OLS regression coefficients, R-squared, cross-correlation, Granger causality, cointegration, mutual information, rolling correlation, distance correlation, p-values, confidence intervals, significance stars, standardized beta coefficients, and effect sizes.
The software also includes multiple regression modelling, regression dashboards, forecasting, t-tests, ANOVA, group statistics, moderation analysis, and correlation matrix generation. These features make it useful for both academic research and applied decision-making.
AI-Powered Insight System
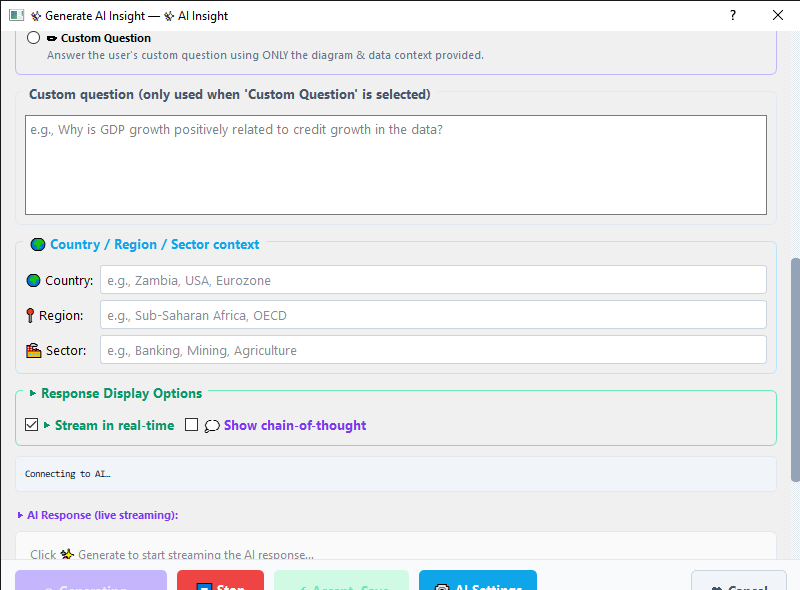
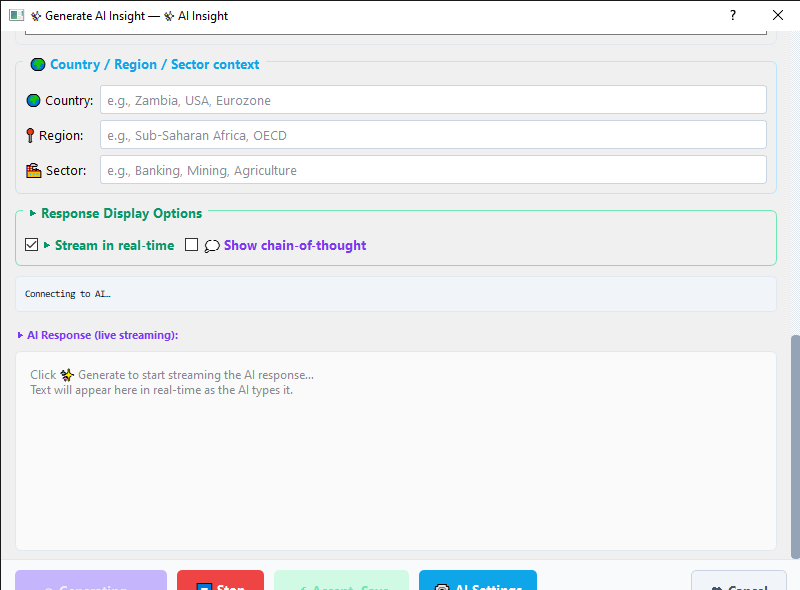
One of the strongest features of Witika Economic Design is its AI-powered self-explanatory bubble system. Users can attach AI bubbles to any node, connection, region, or other bubble. The AI can then generate explanations based on the selected diagram context and the underlying data.
The AI system can produce different types of explanations, including interpretation of results, theories and studies support, policy recommendations, holistic system explanations, country or region comparisons, forecast explanations, and custom responses.
The software supports multiple AI platforms, including OpenRouter, DeepSeek, OpenAI, Anthropic, Google Gemini, Groq, Mistral AI, Ollama Local, and Custom API endpoints. This gives users flexibility to choose the AI model and provider that best fits their needs.
Witika Economic Design also includes real-time AI response streaming, allowing AI responses to appear token by token as they are generated. Users can stop streaming at any time and save partial responses. The software also includes display controls for reasoning or thinking outputs, giving users the option to show or hide chain-of-thought style reasoning where supported by the selected AI model.
Forecasting and Scenario Analysis
Witika Economic Design allows users to generate forecast nodes from dependent variables using connected independent variables. The forecasting system applies multiple regression and extrapolates future values using methods such as linear trend extrapolation, hold-last-value, historical mean, moving average, and drift.
Forecast outputs include future predictions, confidence intervals, historical trend visualization, model fit information, R-squared values, regression coefficients, and forecast ranges. This makes the software useful for economic projections, business planning, policy simulation, demand forecasting, and risk assessment.
Visualization and Export Capabilities
The software is designed not only for analysis but also for communication. Users can create professional diagrams showing variable relationships, statistical results, charts, forecasts, AI explanations, and grouped policy or business regions.
Diagrams can be exported as high-resolution PNG images or scalable SVG files. This makes it easy to include outputs in academic papers, policy reports, corporate presentations, consultancy reports, grant proposals, monitoring and evaluation documents, and teaching materials.
The SVG export option is especially useful because it allows users to create clean, editable vector graphics that can be inserted into documents and presentations.
Who Should Use Witika Economic Design
Witika Economic Design is suitable for:
Researchers and postgraduate students working on empirical studies.
Lecturers teaching economics, statistics, econometrics, business analytics, finance, and policy analysis.
Policy analysts preparing evidence-based reports and recommendations.
Government departments and agencies working with economic and social indicators.
Corporate analysts conducting business, market, financial, and operational analysis.
Consultants preparing client reports, diagnostic studies, forecasts, and strategic recommendations.
NGOs and development organizations analysing project indicators, outcomes, and policy impacts.
Think tanks and research institutions producing analytical briefs and policy papers.
Why Clients Should Choose This Software
Witika Economic Design combines statistical analysis, diagramming, forecasting, and AI explanation in one integrated environment. Instead of switching between spreadsheets, statistical packages, charting tools, and AI platforms, users can work within a single visual workspace.
The software is particularly valuable because it helps users see relationships, not just calculate them. It transforms data analysis into a visual, interactive, and explainable process. This makes it easier to communicate complex findings to non-technical audiences while still preserving statistical depth for expert users.
For academic users, it supports research design and empirical interpretation. For corporate users, it supports business intelligence and strategic decision-making. For policymakers, it supports evidence-based policy design and communication.
Trial and Subscription Information
Trying Witika Economic Design is free of charge. Clients can run and test the software for free until the expiry of the trial version. After the trial period expires, clients can decide whether to subscribe and continue using the software.
The subscription fee is K300 per month for Zambian clients and USD 50 per month for clients from foreign countries.
The payment method is open to discussion with each client because different clients may prefer different payment options. Clients are also free to cancel their subscription at any time.
Please subscribe to continue using this software after the trial version expires.
Subscription Assistance
For subscription assistance, please contact Research Expert Solutions by email at:
resgroup@research-expert-solutions.com
Alternatively, for a prompt response, you can call or send a WhatsApp message to:
+260 972 412 315
We look forward to assisting you.