Price: K500
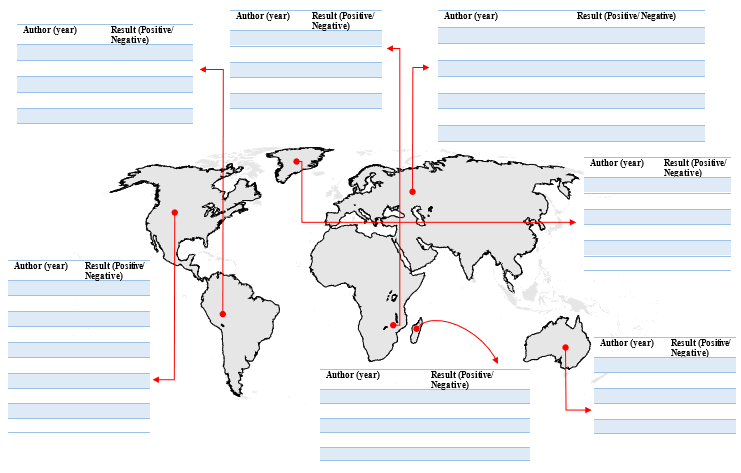
The World Map Literature Review Summary Diagram Template V1 by Research Expert Solutions is an innovative, visual tool designed to help researchers summarize and present reviewed literature in a global context. This template, provided in Word format, features a world map with editable table sections overlaying each continent, where users can document information about study authors, research findings, and geographic areas covered. It allows users to effectively capture insights from studies conducted in different regions, presenting a comprehensive, visually engaging overview of global, regional, and local research perspectives.
The value of this template lies in its ability to simplify complex literature reviews by organizing key findings spatially across the world map. This not only makes it easier for researchers to identify geographical trends and research gaps but also enhances presentations by offering a clear, impactful visualization of literature across diverse regions. For researchers, this means more organized and memorable literature summaries, which are particularly valuable when communicating findings to stakeholders or academic audiences.
The World Map Literature Review Summary Diagram Template V1 is especially beneficial for graduate students, academic researchers, and consultants conducting literature reviews that span multiple countries or continents. It also serves policy analysts and industry researchers who need to present findings from global studies in a way that highlights regional insights and variations.
Price: K800
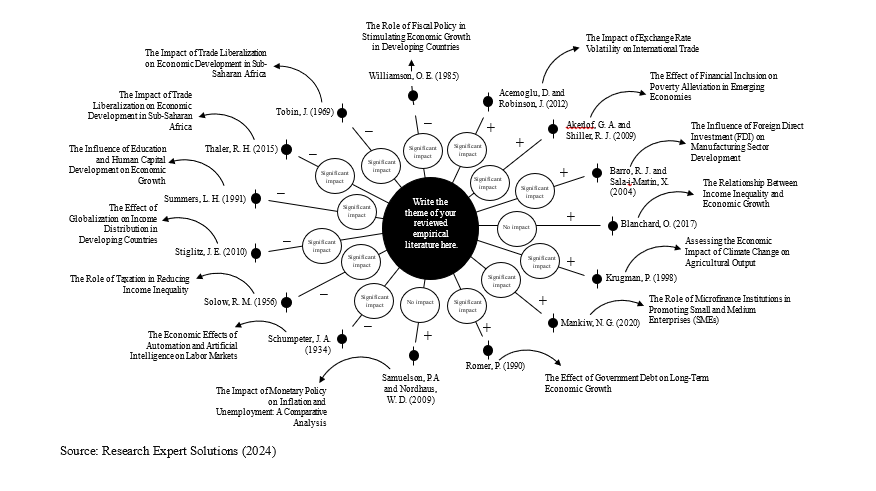
The Oval Empirical Literature Summary Diagram V2 for Effect/Impact Analysis Studies by Research Expert Solutions is a specialized tool for organizing and presenting empirical literature reviews in a streamlined, visual format. Available in Word, this diagram features an oval structure where users can input key details of each study they review, including the study’s authors, title, the nature of the analyzed effect or impact (categorized as positive or negative), and the significance level (significant or not). This structured format helps researchers quickly summarize and compare the effects observed across multiple studies, making it easy to identify patterns, contrasts, or trends in the literature.
The value of the Oval Empirical Literature Summary Diagram V2 lies in its ability to simplify complex empirical reviews, providing an efficient way to document and interpret the impacts reported in various studies. This format is particularly useful for researchers conducting meta-analyses or systematic reviews who need to assess multiple studies side by side. By organizing findings visually, the template enhances clarity and makes research presentations more engaging and accessible.
This product is ideal for graduate students, academic researchers, and research consultants who are involved in effect or impact analysis studies. It is especially valuable for those preparing literature reviews in fields like social sciences, economics, and policy analysis, where clear interpretation of empirical impacts is crucial for decision-making and scholarly communication.

Price: K1000
The Literature Review Depth Analytical Framework Diagram by Research Expert Solutions is a powerful Excel-based tool designed to help researchers visualize and analyze the depth of literature reviewed from global, African (regional), and local perspectives. This diagram enables users to enter the number of studies reviewed at each level, indicating study results as either positive or negative, and it automatically generates graphical visualizations that show both the volume and strength of literature in each perspective. With an intuitive color gradient from deep red (indicating a high concentration of studies) to lighter red (indicating fewer studies), the tool visually emphasizes areas where literature is strong or sparse. This added feature of result categorization enables a nuanced view of research outcomes, helping users quickly assess the prevalence of positive versus negative results at each level. Upon completing data entry, users can easily export the diagram as an image for seamless integration into Word documents.
The value of the Literature Review Depth Analytical Framework Diagram lies in its ability to provide a clear, color-coded view of the literature’s breadth, depth, and directional outcomes across different perspectives. This helps researchers identify research gaps, areas of concentration, and trends in results. The framework simplifies complex reviews, supporting engaging presentations of research insights in visual format, particularly valuable in literature reviews and scholarly presentations.
This product is ideal for graduate students, academic researchers, and consultants who conduct systematic reviews or comparative studies across global, regional, and local levels. It is especially beneficial for those presenting findings to stakeholders who appreciate visual, data-driven summaries of literature scope, strength, and result trends.

Price: K1500
The Literature Review Spider Web Matrix Correlation Diagram by Research Expert Solutions is an advanced Excel-based tool that assists researchers in visually organizing and analyzing empirical literature reviews. This diagram allows users to summarize studies reviewed from global, African (regional), and local perspectives, automatically generating graphs that showcase the depth and strength of literature across these levels. Users can document the number of studies reviewed at each perspective, detailing data sources (primary data via questionnaires or interviews, secondary data, literature analysis, or document analysis) and research approaches used (qualitative, quantitative, systematic reviews, or desk reviews). The spider web matrix reveals correlations between regions and data collection/analysis methods, enabling researchers to easily identify methodological trends and potential research gaps.
The value of this diagram lies in its ability to visually illustrate patterns across diverse literature sources and approaches. Correlation strengths are displayed as red web connections within the matrix—where intense red indicates strong correlations (due to a high number of studies using particular methods) and lighter red reflects weaker correlations. This color-coded feature allows researchers to quickly spot underexplored areas, gaining insight into which perspectives or data methods are commonly utilized or overlooked. Once data entry is complete, users can export the diagram as an image, making it easy to integrate into Word documents or presentations for impactful, visually engaging literature summaries.
The Literature Review Spider Web Matrix Correlation Diagram is particularly beneficial for graduate students, academic researchers, and consultants conducting complex literature reviews that cover multiple regions and methodologies. It serves as a powerful tool for those aiming to identify gaps, trends, and correlations within their literature, making it invaluable in fields such as social sciences, public health, and policy analysis. This product is also ideal for researchers who present findings to stakeholders, as it offers clear, data-driven insights that highlight research strengths and gaps across global and regional studies.

Price: K500
The Literature Review Author Network Diagram by Research Expert Solutions is a dynamic tool provided in Microsoft Word format, designed to help researchers visually organize and present findings from empirical studies by author. This diagram allows users to list authors’ names and assign colors to represent different findings, categorizing each study as having identified a positive impact/effect, a negative impact/effect, or no impact/no effect. By color-coding authors’ findings, the diagram creates a clear and immediate visual summary, enabling researchers to easily identify and compare diverse conclusions within the literature. This structure is particularly helpful in assessing the overall trends and variances in research outcomes.
The value of the Literature Review Author Network Diagram lies in its ability to simplify complex literature reviews, providing a streamlined view of author contributions and study results at a glance. This tool is ideal for researchers preparing for literature reviews, systematic reviews, or meta-analyses, as it assists in quickly identifying prevailing outcomes and unique insights across studies. The color-coded author network diagram enhances clarity and organization in research documentation and is particularly beneficial for graduate students, research consultants, and academic professionals who aim to communicate their findings to an audience in an accessible, visually engaging way